

Reading the market
Supporting layers
Levels, volume profile, auction marks, order blocks, VWAP, the footprint and big trades: where the auction did business, with a picture of each.
These layers show where the auction did business and what the day's average price is. They give the zones their context. Each one below has a picture of the layer alone on the BTC perpetual.
Levels
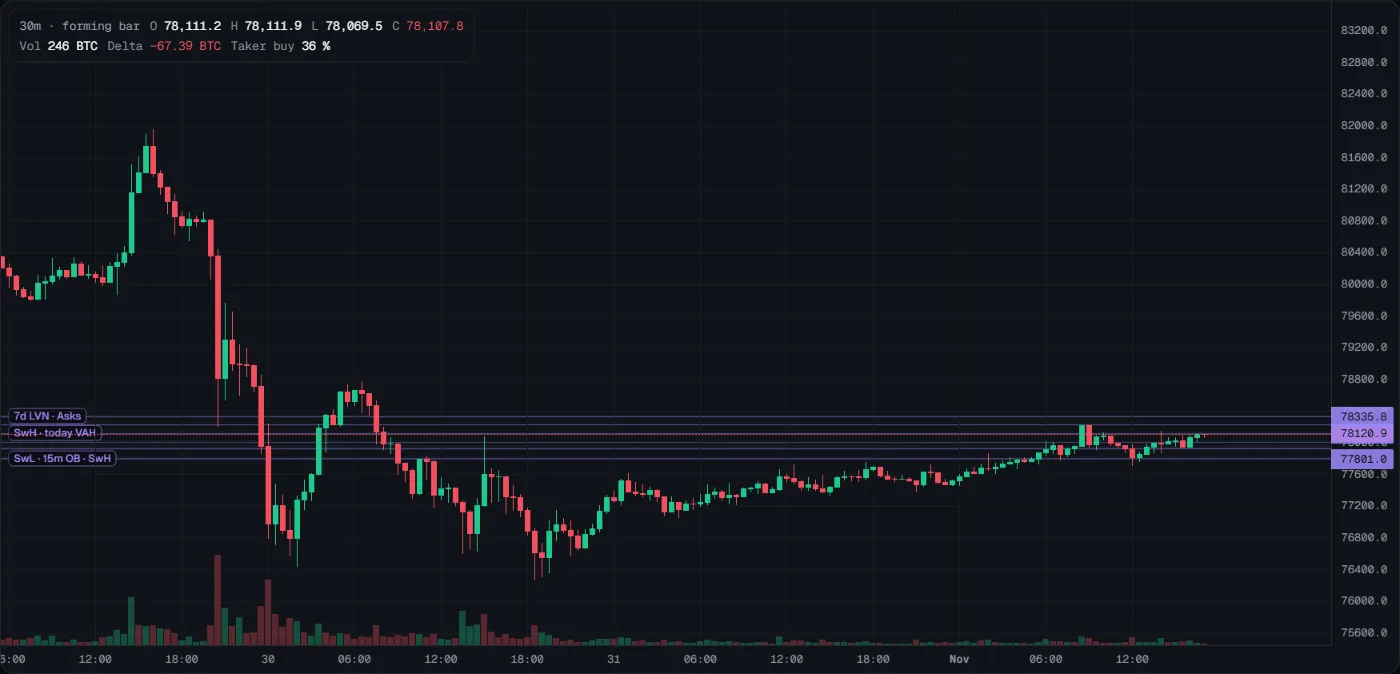
- What you see
- Purple lines with short names on the left and their price on the right axis. Only the levels nearest price are drawn. In the picture, three lines sit within about 300 USD of price: 7d LVN · Asks at 78,336 (a low-volume price of the last 7 days and resting asks in the book), SwH · today VAH at 78,121 (a swing high and the top of today's value area) and SwL · 15m OB · SwH at 77,801 (swing points and a 15-minute order block).
- How to read it
- Each level is a price where the market did business before: prior day high, low and close (PDH, PDL, PDC), swing highs and lows (SwH, SwL), VWAP, value area (VAH, VAL), POC and volume nodes (HVN, LVN).
- One line with several names is several references at one price: it is stronger than one alone.
- The Overview lists the few that matter most, ranked by importance and distance.
- What it tells you
- Where traders watch for reactions (Tactiq has not measured how often they happen there). It does not tell you a reaction must happen, or which way.
- How to use it
- Mark the nearest level above and below price before you trade. If price drops to the PDC · SwL line in the picture, watch delta and the footprint there: buyers step in and price holds on a close, a bounce is possible; a close below it with sellers in control means the cluster gave way.
- Common mistakes
- Entering just because price touched a level. Wait for flow to confirm.
- Treating all levels alike. A cluster of several references matters more than a single one.
Volume profile
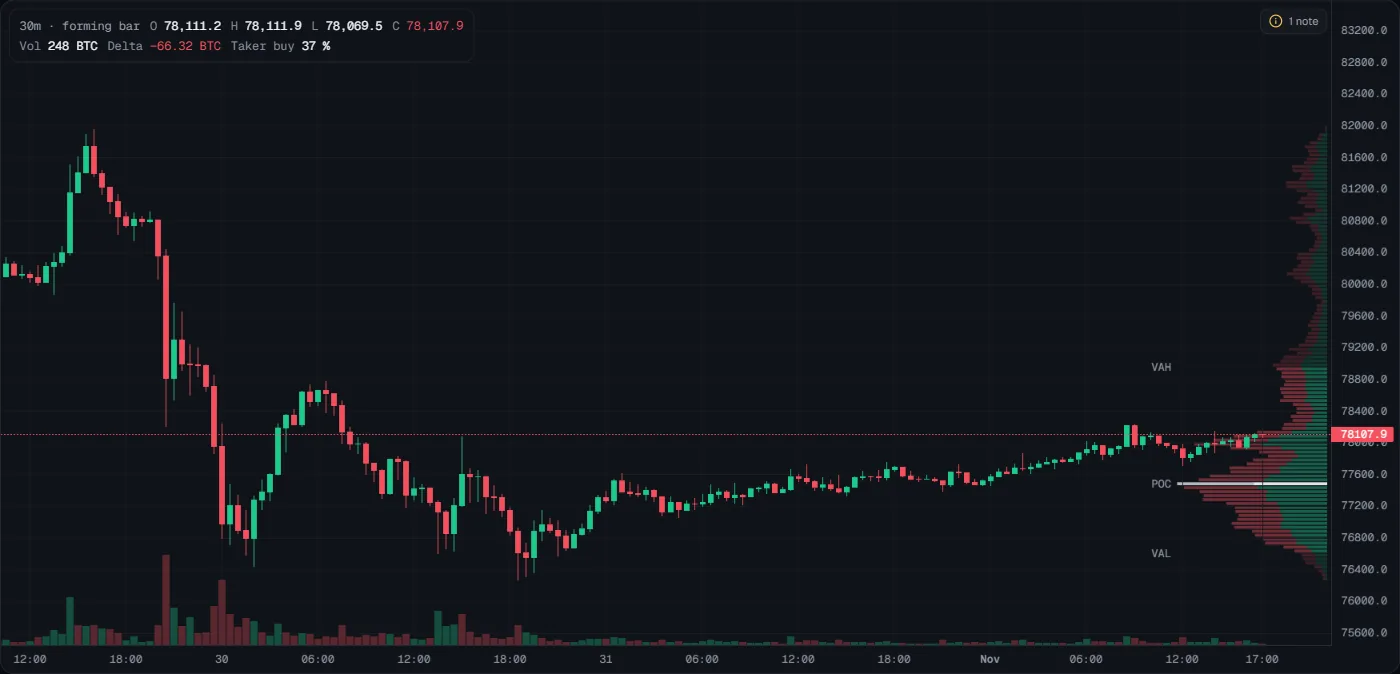
- What you see
- A sideways histogram at the right edge: one row per price, longer = more volume traded there. Each row is split into taker selling (coral, outer) and taker buying (teal, inner). The brighter part is the value area (70 % of the volume), from VAL (about 76,600) to VAH (about 78,900). The white row is the POC, the price with the most volume (about 77,500 in the picture, about 600 USD under the last price).
- How to read it
- Price inside value: the market accepts these prices.
- Price outside value: it is testing new prices.
- Thin rows (low volume) were crossed fast; traders expect price to move fast through them again (Tactiq has not measured this).
- What it tells you
- Where the auction agreed on price, for the range on screen. Price that leaves value and is accepted (two closes outside) may move on. Price that comes back inside may return to the POC. It does not tell you when.
- How to use it
- Know whether you are inside or outside value before you trade. Inside value, expect rotation and be careful chasing breakouts. In the picture price sits inside value, above the POC and below VAH: not an edge for either side.
- Common mistakes
- Forgetting that the profile changes when you pan or zoom: it describes the range on screen.
- Comparing profiles of two different zoom levels as if they were the same.
Auction marks
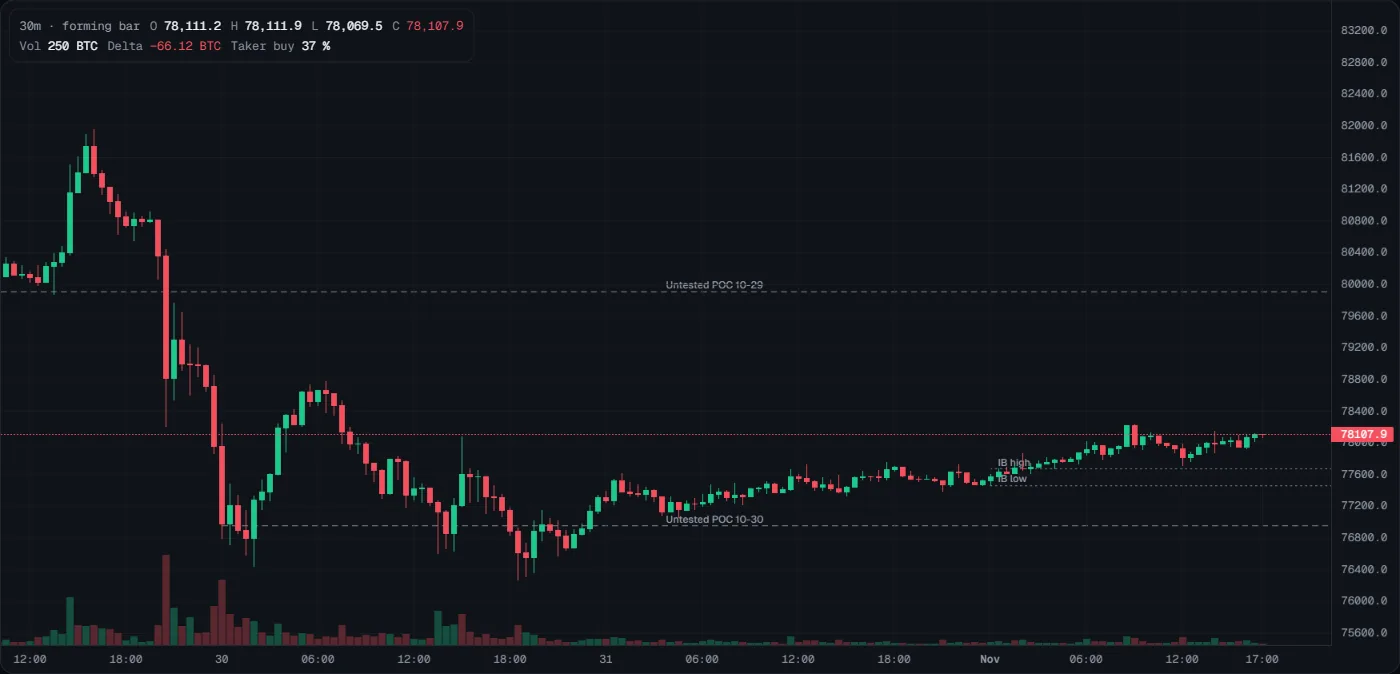
- What you see
- Dashed and dotted grey lines with names. In the picture: Untested POC 10-29 (about 79,900) and Untested POC 10-30 (about 76,950), and the initial balance of 1 November (IB high, IB low), the range of the first hour of the UTC day.
- How to read it
- Untested POC: a prior day's busiest price that price has not touched again.
- Single print: a price that one 30-minute period crossed fast and no later period revisited.
- Poor high or low: an extreme that was not rejected clearly.
- IB high and low: a break of the first hour's range shows which side took the day's initiative.
- What it tells you
- Where the auction left work unfinished. Auction theory says price tends to return to them. Tactiq has not measured that.
- How to use it
- Use them as possible targets and as places to watch, not as entries. For example, an untested POC above price is a reasonable first target for a long that is already working.
- Common mistakes
- Expecting every untested POC to be filled soon. Some stay open for weeks.
- Looking for single prints early in the UTC day: they need at least two completed periods.
Order blocks
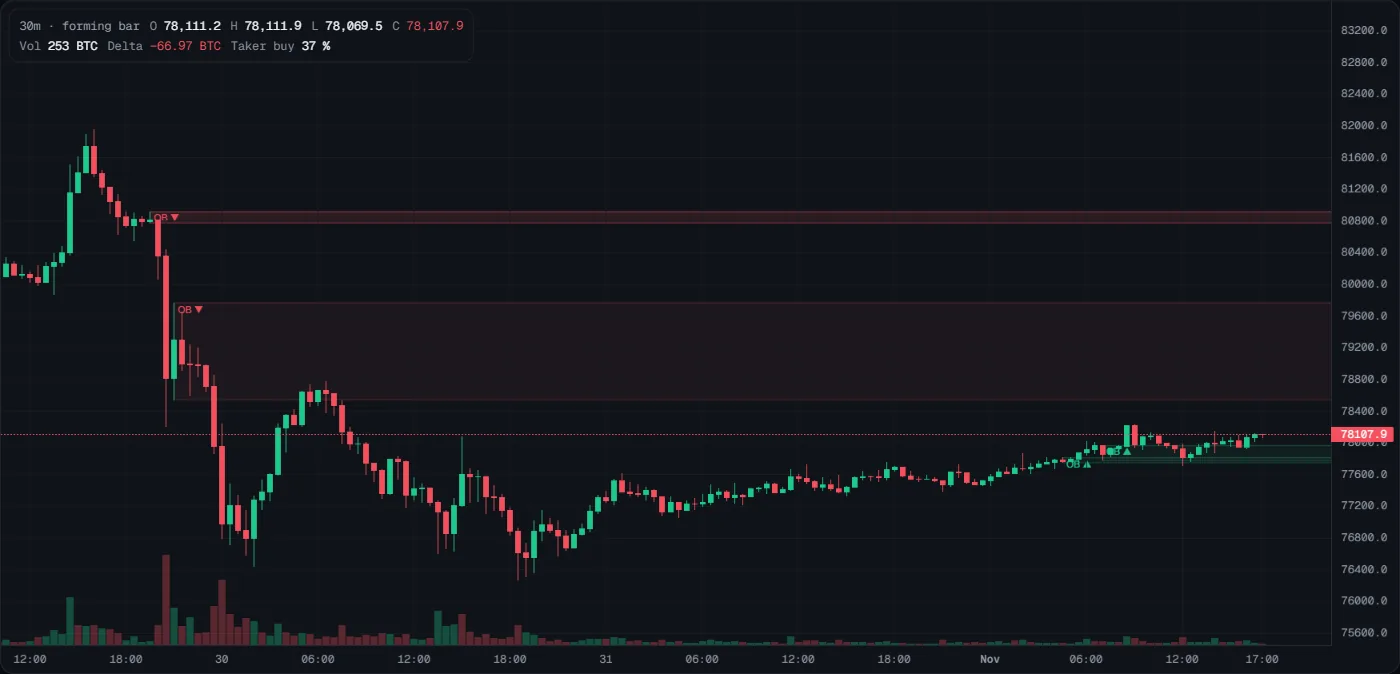
- What you see
- Boxes labelled OB. Red with ▼ is a supply block (it may stop a rally); teal with ▲ is a demand block (it may hold a dip). In the picture, two supply blocks sit above price: the tall box from about 78,550 to 79,750 starts at the up bar inside the fall of 29 October (about 21:00, between the two red legs); the thin block near 80,800 is the one from just before the fall began. Two small demand blocks near 77,800, from the climb of 1 November, sit just under price.
- How to read it
- An order block is the last opposite bar before a strong move through a swing (5m bars and longer).
- A demand block below price can support it. A supply block above price can stop it.
- A block that price closes through is broken.
- What it tells you
- Where the last opposite business happened before a strong move. It does not tell you that orders still wait there.
- How to use it
- Use blocks as zones for patience, not as entries. If price rallies into the tall supply block in the picture, watch whether sellers appear (flow zones, negative delta); if price closes above the block, the block is broken. Blocks also feed the Areas that strategies use.
- Common mistakes
- Shorting the first touch of a supply block without any sign from flow.
- Assuming blocks are proven. Tactiq has not measured order blocks; at heavy and flow zones, its studies found price reacted no more often than at random levels.
VWAP
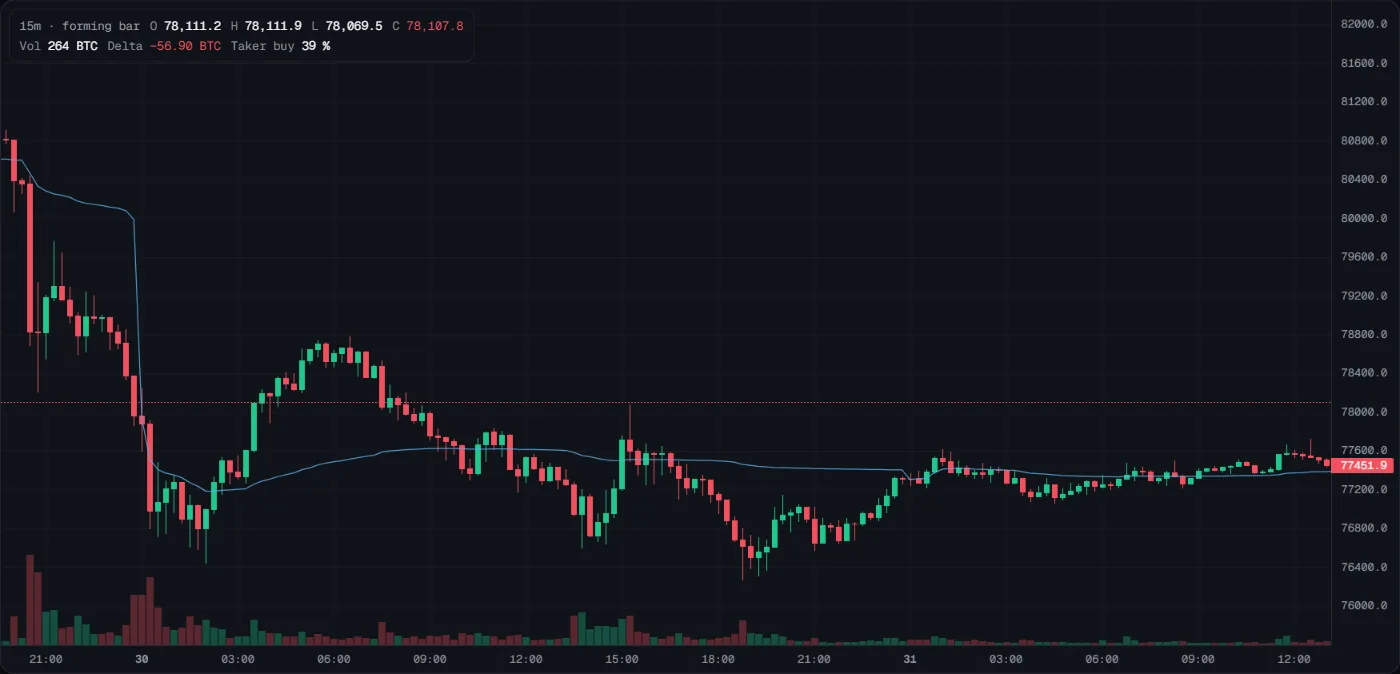
- What you see
- One thin blue line: the average price traders paid today, weighted by volume, from 00:00 UTC. In the picture the line falls sharply near the left edge, at the 30 on the time axis: that is the daily reset, when VWAP starts again from the new day's first bar. On 31 October price sits just above it.
- How to read it
- Above VWAP, buyers control the session on average. Below, sellers do.
- A close back across VWAP against the trend is a sign the trend is fading.
- What it tells you
- Who is "winning" today on average. It does not tell you that VWAP will hold as support or resistance.
- How to use it
- In a clear up day, traders often watch pullbacks to VWAP for buyers to return (Tactiq has not measured whether they hold). If price chops back and forth across VWAP, as on 30 October in the picture, there is no trend to lean on.
- Common mistakes
- Reading the 00:00 UTC reset jump as a price move.
- Trading every touch of VWAP in a range day.
Footprint
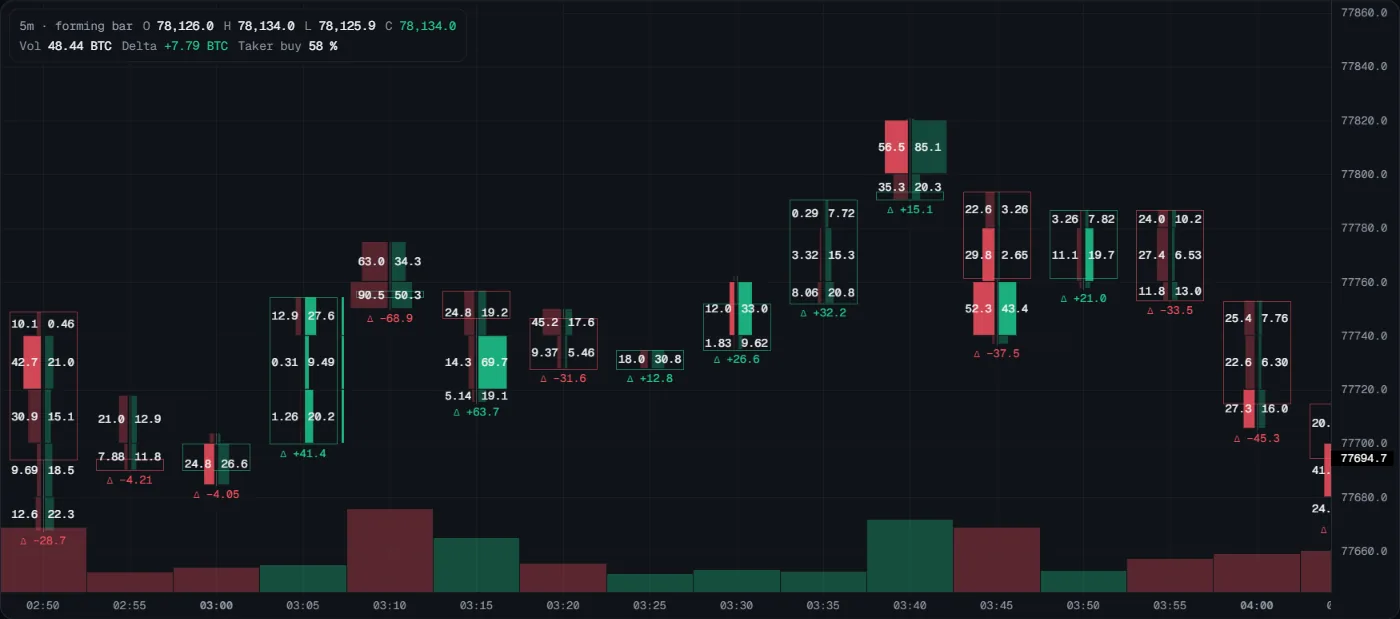
- What you see
- Zoom in on 1m to 1h bars and each bar becomes an outlined box (its range) split into price rows. Left of the centre: aggressive sells (red). Right: aggressive buys (teal). Zoomed in far enough, each row shows its volume in BTC and Δ (the bar's delta, buys minus sells) sits under the bar. A full-colour cell is an imbalance (one side at least three times the other, on the diagonal). In the picture, the 03:15 bar bought 69.7 BTC against 14.3 sold near 77,725 (Δ +63.7): buyers pushed. The 03:10 bar is the opposite at the top, 90.5 sold against 50.3 bought near 77,755 (Δ −68.9): sellers met the push there, and price did not get above it for the next 20 minutes.
- How to read it
- Three or more bright cells of one side in a row are a stack. A stack makes a flow zone.
- Strong delta with no progress in price is absorption: someone took the other side.
- Big numbers at the high or low of a bar show where the fight was.
- What it tells you
- Who was aggressive at each price, and whether price moved for them. It does not show resting orders: the footprint is executed trades only.
- How to use it
- This is the tool for "did they defend it?". When price reaches a zone or a level, zoom to 1m to 5m: buy imbalances and positive delta at a teal zone mean buyers defend; sell imbalances and price closing through mean they do not.
- Common mistakes
- Expecting the footprint on high timeframes or zoomed out: zoom in on 1m to 1h.
- Reading a bar with missing trades: Tactiq draws a bar only when it has all of its trades.
Big trades and liquidations
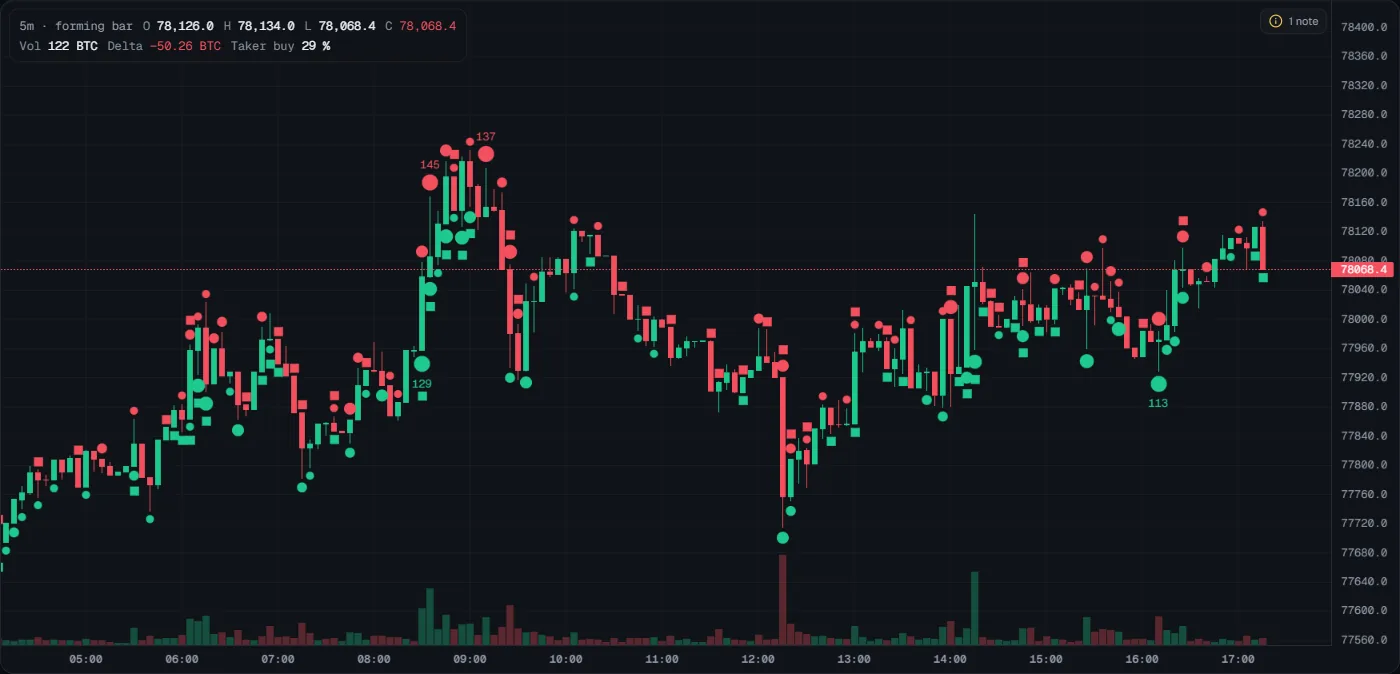
- What you see
- Circles are large aggressive trades (10 BTC and up on the perp by default) and squares are liquidations. Teal below the bar: buys. Red above the bar: sells. Bigger marks mean bigger size, and trades of 100 BTC and more carry their size in BTC. In the picture: a 129 BTC buy at about 08:30 at the start of the run to 78,200, 145 and 137 BTC sells at about 08:35 and 09:05 near its high, and a 113 BTC buy at about 16:10 on a dip. Big trades are kept for one day, so on a longer view the markers start about 24 hours back.
- How to read it
- A cluster of big sells at a high, with no follow-through, is selling met by buyers.
- A cluster of liquidation squares is forced flow: traders were closed out, not choosing to trade.
- Compare big buys and big sells at the same price: both sides were active there.
- What it tells you
- Where large or forced trades happened. Forced flow is sometimes read as the end of a move rather than the start; Tactiq has not measured this.
- How to use it
- After a fast drop with many red liquidation squares, do not chase the move short: forced selling may be ending. Wait for the next closed bar and see whether buyers appear.
- Common mistakes
- On a view longer than a day, reading the empty left part as "no big trades": they are only kept for 24 hours.
- Counting liquidations: Binance sends at most one per second, so Tactiq shows a sample.
Last updated 2026-10-31. This page as Markdown: /docs/supporting-layers.md