

Reading the market
Liquidity heatmap
The liquidity heatmap shows resting order-book liquidity over time near price: where size sat, was pulled or came back.
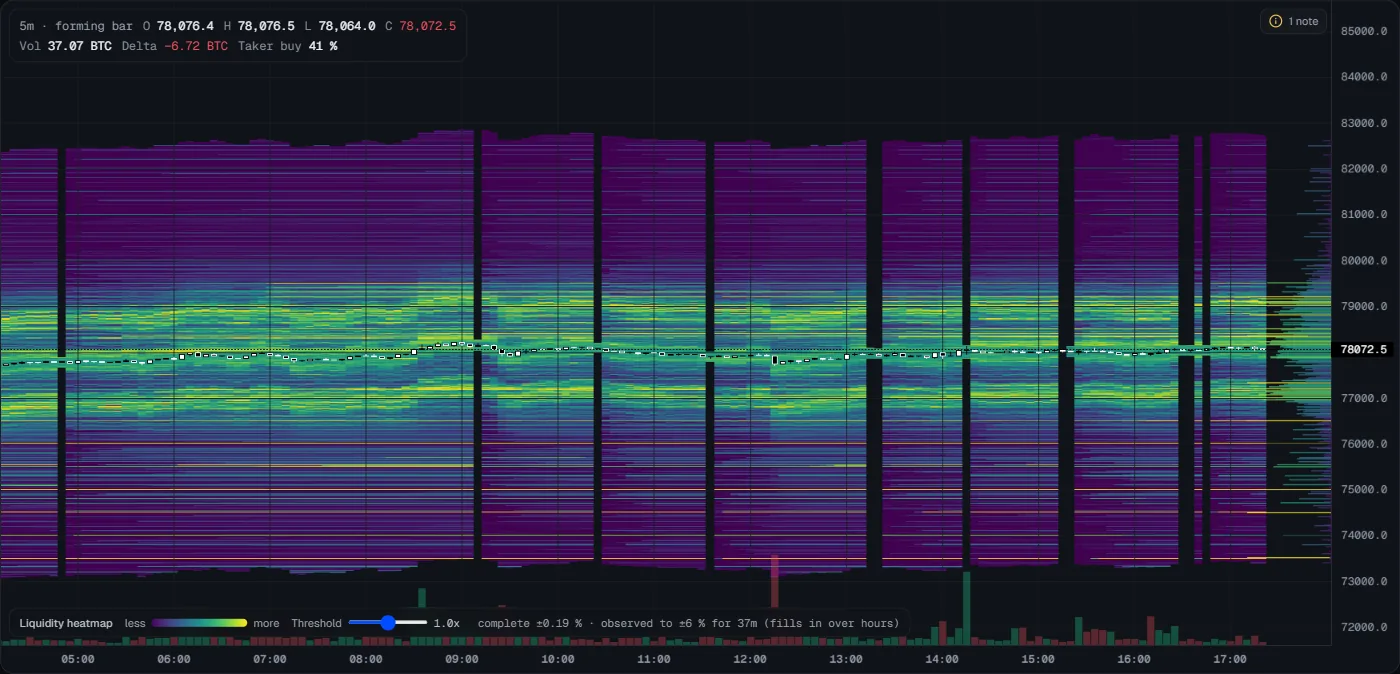
The liquidity heatmap draws the orders resting in the book, over time, to 6 % either side of price. It answers: where is size waiting, did it stay, and was it pulled? Turn it on with Indicators → Resting liquidity or press h.
- What you see
- Colour is resting size: deep purple is little, then blue and green, and yellow is a wall. The candles run through the middle. In the picture, the thickest liquidity sits in bands just above (about 78,900) and below (about 77,200) price, and thin yellow streaks near 75,500, 74,500 and 73,500 stayed all day. The black columns are times Tactiq has no book record for. The bars at the right edge are the depth of the forming bar. The legend says the book is complete within ±0.19 % here and how long the wider range has been watched (37 minutes in this shot, so the far range is still filling in).
- How to read it
- A long yellow streak is a wall that stayed. A streak that ends just before price reaches it was pulled.
- A wall that stays while price trades into it may be absorbing. Price can slow or turn there.
- Thin purple within the complete range (the legend says how far) is a clear path: price can move fast through it. Further out, thin purple can simply mean not seen yet.
- Hover for the price range, the resting size and its value in USD.
- What it tells you
- Where orders are waiting now, and whether they stayed. It does not tell you they will be there when price arrives: resting orders can be cancelled at any moment.
- How to use it
- Before you place a stop or a target, look for walls and thin paths. A target just in front of a big wall that has stayed for hours is more realistic than one past it. When price reaches the wall, check delta and the footprint: trades into it with no progress means it is absorbing. The wall vanishes as price arrives: do not rely on it.
- Common mistakes
- Treating a wall as a promise. Walls are often pulled; trades are facts, orders are not.
- Reading black columns as an empty book. They are times with no record.
- Judging the far range right after a restart: it fills in over hours, as the legend says.
What it can and cannot see
- Recorded live. Binance publishes no history of the order book, so Tactiq collects it. Before Tactiq started watching, there is nothing.
- Complete near price, a lower bound further out. Binance's snapshot covers about ±0.15 % on the perpetual. Beyond it, Tactiq shows the orders its live feed has reported since it last watched without a break. A large order that has not changed since then is missing until it does. The hover readout says which range is complete, and the legend says for how long the book has been watched.
- Recovery is measured. After a restart, Tactiq recovered about 88 % of resting size within 1 minute and 97 % within 5 minutes. The far range is drawn only after a 5-minute warm-up.
- Contrast. The Threshold slider in the legend (also in Settings) sets how much size turns yellow.
Resting orders can be cancelled at any moment. They are promises. Trades are facts. Read walls together with order flow.
Last updated 2026-10-31. This page as Markdown: /docs/liquidity-heatmap.md