

Options gamma: advanced (off by default)
Options panes
Off by default: the dealer sentiment strip and the net gamma, options flow, options delta and options volume panes, and how to read each.
Panes under the chart that show options activity bar by bar. They are off by default; turn each on in Indicators → Panes below the chart. Dealer positions come from your Gamma model setting. The default, taker-flow, replays every Deribit option trade since listing and assumes the side that did not hit the trade is a dealer. Classic assumes dealers are long every call and short every put. Both are estimates.
Dealer sentiment
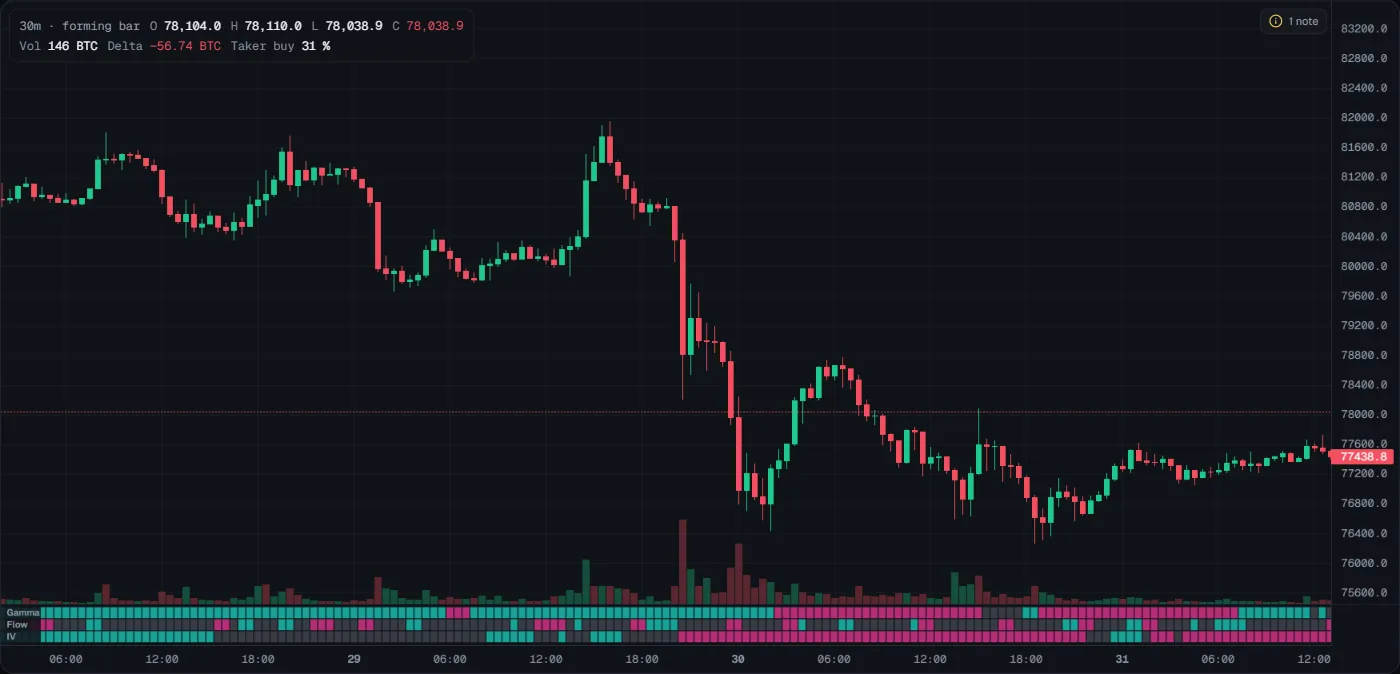
- What you see
- A strip with three rows, one cell per bar. Gamma: teal dealers long gamma, magenta short. Flow: options delta customers added over the last hour, teal up, magenta down, grey flat. IV (implied volatility, 30 days): magenta rising, teal falling, grey flat, against 24 hours before. Hover a cell to read it in words. In the picture, Gamma is mostly teal before the fall and mostly magenta on 30 October; IV turns magenta (rising) at the fall of 29 October and stays so: a calm market that turned fast and nervous.
- How to read it
- All teal: a calm, long-gamma market with options buyers adding upside and volatility falling.
- Gamma magenta and IV magenta together: a nervous, fast market.
- What it tells you
- The options mood in three words per bar. It does not forecast.
- How to use it
- Read it as weather: on magenta-gamma, rising-IV bars, trade smaller.
- Common mistakes
- Reading teal as bullish: in the Gamma and IV rows teal means calm, not up.
Net gamma
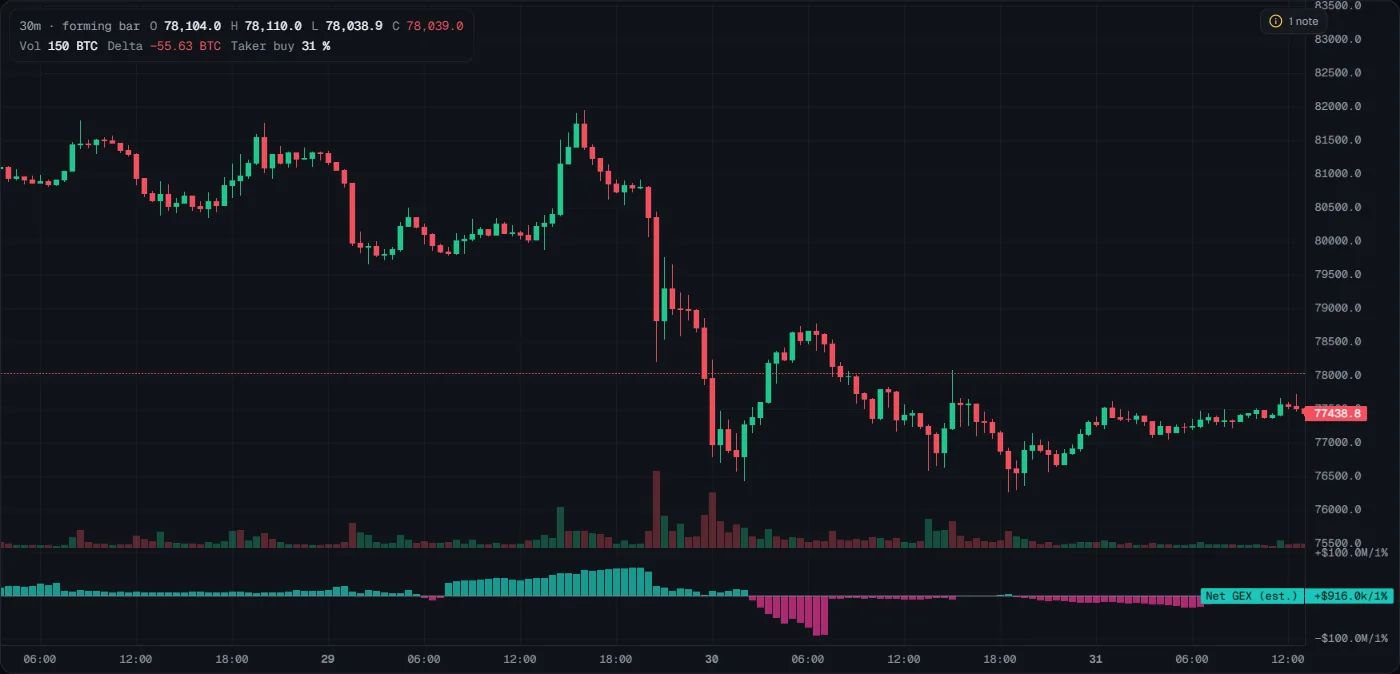
- What you see
- Bars: net dealer gamma per bar, in USD per 1 % move, with the latest value on the right (Net GEX (est.) +$916.0k/1% in the picture). Teal: dealers long gamma (moves damped). Magenta: short (moves amplified). In the picture, gamma was teal and growing through 29 October, then deeply magenta on the morning of 30 October, right after the fall, when price swung about 2,000 USD up and back down.
- How to read it
- Big teal bars: in the model, hedging leans hard against moves.
- A switch from teal to magenta: the model moved to the fast side.
- What it tells you
- How strong the calm or fast effect is, in the model, over time.
- How to use it
- Read it as context, not as a trade filter. In the picture the largest teal bars of the window came just before the 4,000 USD fall of 29 October: long gamma did not stop it. Tactiq has not measured whether net gamma predicts calmer or faster moves in crypto.
- Common mistakes
- Comparing values across BTC and ETH: the sizes differ.
Options flow
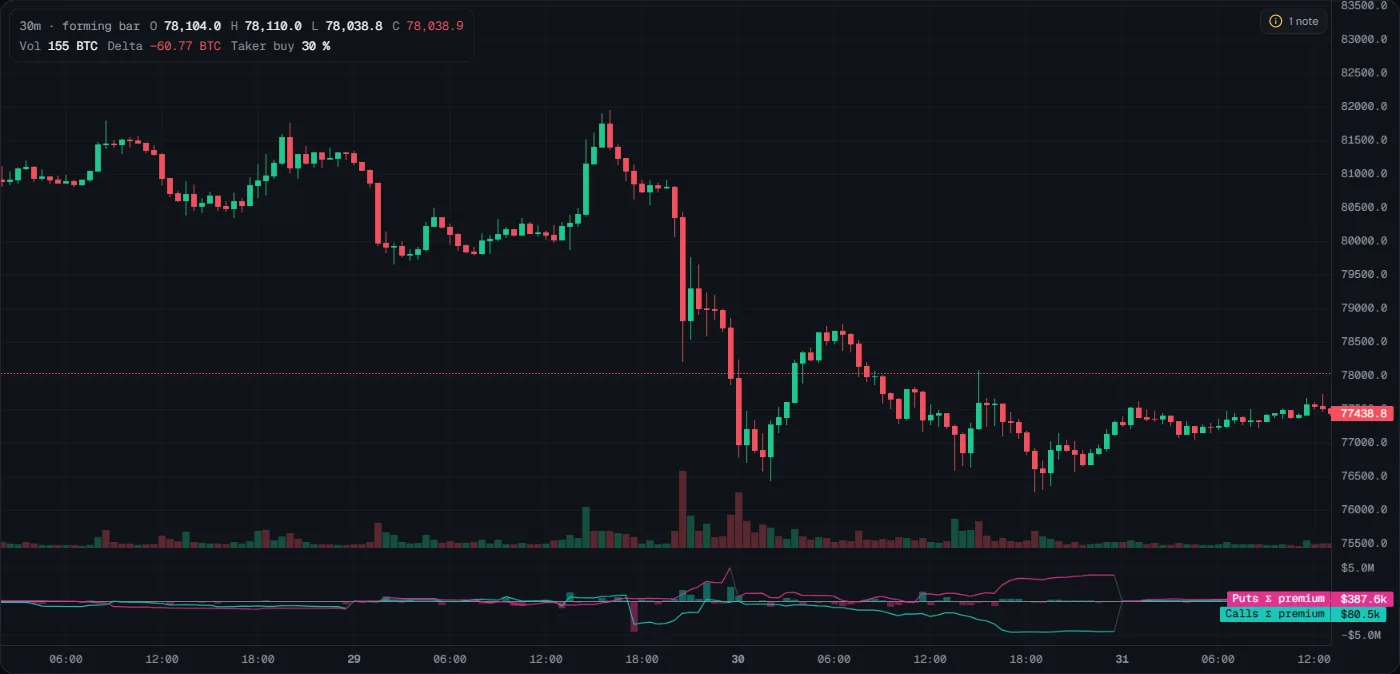
- What you see
- Bars: net customer option flow per bar (calls and puts together; teal = customers net bought options). Two lines: cumulative call flow (teal) and put flow (magenta) since 00:00 UTC, in premium USD or coins (Settings). The lines restart at 00:00 UTC, drawn as a faint grey drop. In the picture, on 30 October the put line climbed to about +$4M (customers paid for puts) while the call line fell to about −$4M (customers sold calls): both lean the same way, toward protection. The tags show today so far: Puts Σ premium $387.6k, Calls Σ premium $80.5k.
- How to read it
- Teal bars mean customers bought options, calls or puts: it is not a direction.
- The call line rising faster than the put line: more money into calls today.
- What it tells you
- How active option buyers and sellers are, and on which side.
- How to use it
- Check whether a move comes with option buying in its direction (calls on a rally, puts on a drop).
- Common mistakes
- Reading teal bars as bullish. Bought puts are teal too.
Options delta
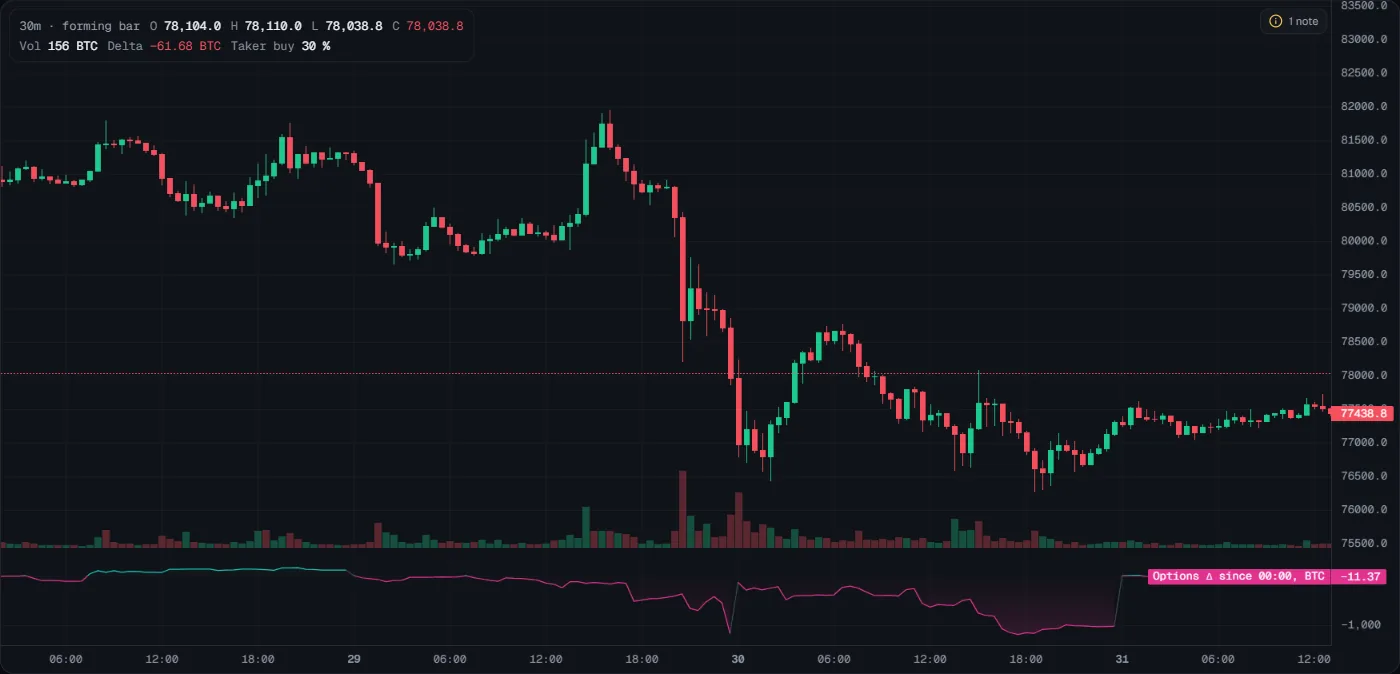
- What you see
- An option's delta is how many coins of exposure it acts like (a call with delta 0.5 on 1 BTC moves like 0.5 BTC). This is not the order-flow Delta pane (taker buy minus taker sell). A filled line: the net delta customers added through option trades since 00:00 UTC, in coins. Teal above zero, magenta below. Intraday timeframes. In the picture, on 30 October customers added about −1,000 BTC of exposure by the afternoon (they leaned short through options); today it is close to flat (−11.37).
- How to read it
- Above zero and rising: customers are adding upside exposure through options. Dealers hedge that by buying.
- Below zero: customers are adding downside exposure.
- What it tells you
- The direction of today's options positioning, in coins of exposure.
- How to use it
- Compare with price: price up with options delta up is a move options traders join.
- Common mistakes
- Ignoring the daily reset: the line starts again at 00:00 UTC.
Options volume
- What you see
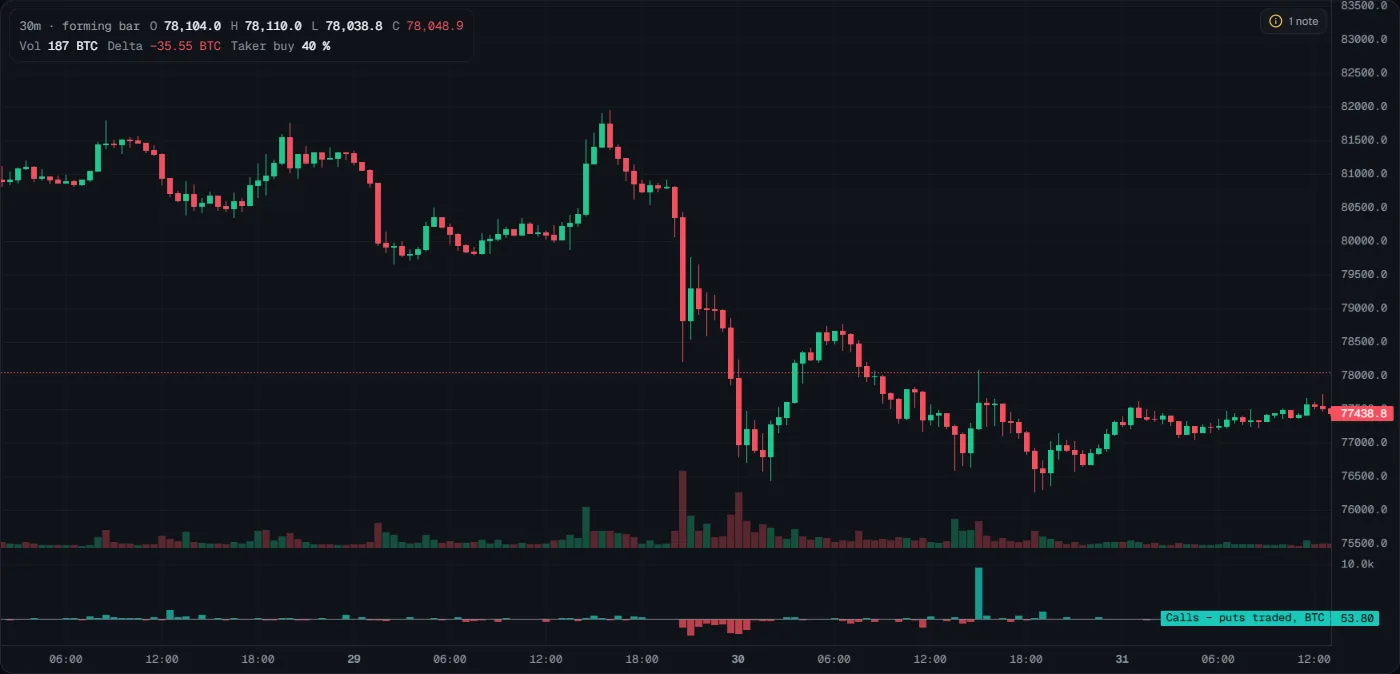
- Bars: calls traded minus puts traded on Deribit per bar, in coins. Teal: more calls. Red: more puts. In the picture, puts dominated during the fall of 29 October (red), and one bar on the afternoon of 30 October traded about 9,000 BTC more calls than puts: the same hour as the large call sale at 82,000 in Big option flows.
- How to read it
- A run of red bars: puts dominate trading, which can be demand for protection (or put selling: volume does not say which).
- What it tells you
- Which kind of option is busier. It does not say who bought or sold.
- How to use it
- Use it with Options flow: volume says what traded, flow says which way.
- Common mistakes
- Treating put volume as bearish: puts are also sold, and bought as insurance by holders.
Every options pane is an estimate from Deribit only. None of them is a signal.
Last updated 2026-10-31. This page as Markdown: /docs/options-panes.md