

Reading the market
Heavy aggression zones
Heavy aggression zones mark prices where one side of the market took an unusually large amount of size within seconds, and how price responded two minutes later.
A heavy-aggression zone marks the prices where one side took far more size than the market usually sees, in a very short time. It answers: where did size hit the market, and did price follow it? Turn it on with Indicators → Executed flow → Heavy aggression.
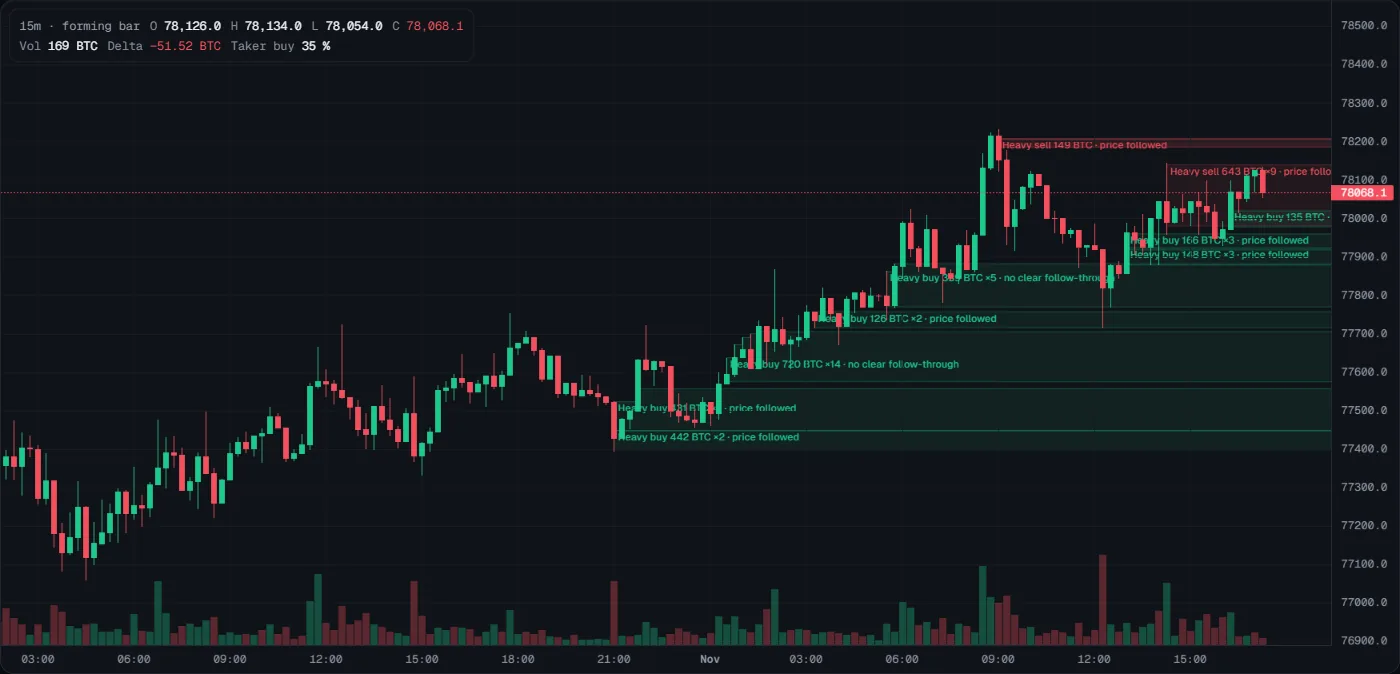
- What you see
- Thin boxes that start where the burst traded and run to the right edge. Each label says the side, the total size, the number of bursts (×2 = two bursts joined) and the response. At the low of the evening of 31 October (about 21:00), Heavy buy 442 BTC ×2 · price followed: buyers hit hard and price rose after. Just before 01:00 on 1 November, Heavy buy 720 BTC ×14 · no clear follow-through: fourteen bursts joined, but price did not move on at once. At the 09:00 high, Heavy sell 149 BTC · price followed: sellers hit and price fell after.
- How to read it
- Teal below price is where buyers were forceful before. Red above price is where sellers were.
- "price followed" means the aggressive side was in control then. "absorbed" means it ran into resting orders and stalled.
- Bigger size and more bursts make a zone more notable, not more certain.
- A zone that price closes through is broken and fades away.
- What it tells you
- Where size really traded, and how price answered within two minutes. It does not tell you who traded (a burst can be a stop run, a liquidation or a hedge) or that price will react there next time.
- How to use it
- When price comes back to a teal zone, zoom in (1m to 5m) and watch the footprint and delta at the zone. Buyers defend it (positive delta, lower wicks, price holds above the box): it is a place for a long idea with the stop below the box. No defence, or a close below it: do not buy; the zone is done. Mirror it for red zones.
- Common mistakes
- Buying the first touch because the box is teal. A zone is a place to look, not a buy signal.
- Calling a zone broken on a wick. Only a close through it ends it.
- Reading "no clear follow-through" as weakness of that side: it only means price did not move enough either way.
How a zone is made
- Sum per second. Tactiq adds up taker buying and taker selling for each second. (In Binance data, a trade where the buyer was the maker means the seller was the aggressor.)
- Rank against the last 24 hours. A second is heavy when its side reaches the 99.9th percentile of that side's active seconds over the trailing 24 hours, and also a fixed minimum size. The threshold for each hour is set from data before that hour, so it never uses the future.
- Merge into a burst. Heavy seconds of one side that are up to 3 seconds apart are one burst.
- Draw a zone. A zone covers the prices where the burst traded. Overlapping bursts of the same side join into one zone while the older zone is still alive and the joined box stays within 2 ATR. The zone shows the total size and the number of bursts.
- Show it only if it is big enough. A zone appears once its bursts add up to the minimum for the instrument. Smaller ones are noise.
| Instrument | Heavy second (default minimum) | Zone total (default minimum) |
|---|---|---|
| BTCUSDT perpetual | 25 BTC | 90 BTC |
| BTCUSDT spot | 8 BTC | 10 BTC |
| ETHUSDT perpetual | 600 ETH | 2,200 ETH |
| ETHUSDT spot | 160 ETH | 190 ETH |
| XAUUSDT perpetual (gold) | 87 oz | 270 oz |
The minimums are set by equal rarity: each is the size that is just as unusual in that market. A zone needs about 12 hours of recorded trades before it can show, because a 99.9th percentile of a few thousand values moves with every hour.
The response label
Two minutes after a burst ends, Tactiq compares price with the burst's average price, in units of a normal one-minute move (the median range of the day before). The zone gets one label:
| Label on the chart | What happened | What it suggests |
|---|---|---|
| price followed | Price is beyond the burst's average price, in its direction, by more than half a normal one-minute move. | The aggressive side was in control. |
| absorbed | Price is back on the other side of the burst's average price by that much. | The aggression met resting orders and stalled. |
| no clear follow-through | Neither. | No clear result. Also shown when Tactiq has less than an hour of price history to judge a normal move by. |
| reading… | The two minutes have not passed. | Wait. |
More ways to read it
- A fresh zone, price far away: watch it on its first return. Tactiq's own study found price reacted there no more often than at random levels, so treat it as a place to look, not an edge.
- An absorbed buy zone: buyers hit a wall. It marks where a rally ran into supply.
- Stacked with a flow zone or a level: two independent measurements at one price. Tactiq marks such a place as an Area (see Strategies).
A taker burst is not "an institution". It can be a stop run, a liquidation, an algorithm slicing an order, or a hedge. The size rule and the followed or absorbed rule come from first principles. Tactiq's historical study of zone revisits (1,728 tests) found no measurable edge over random levels. Tactiq keeps measuring forward, and it does not change the zones unless that evidence says so.