

Options gamma
Big option flows
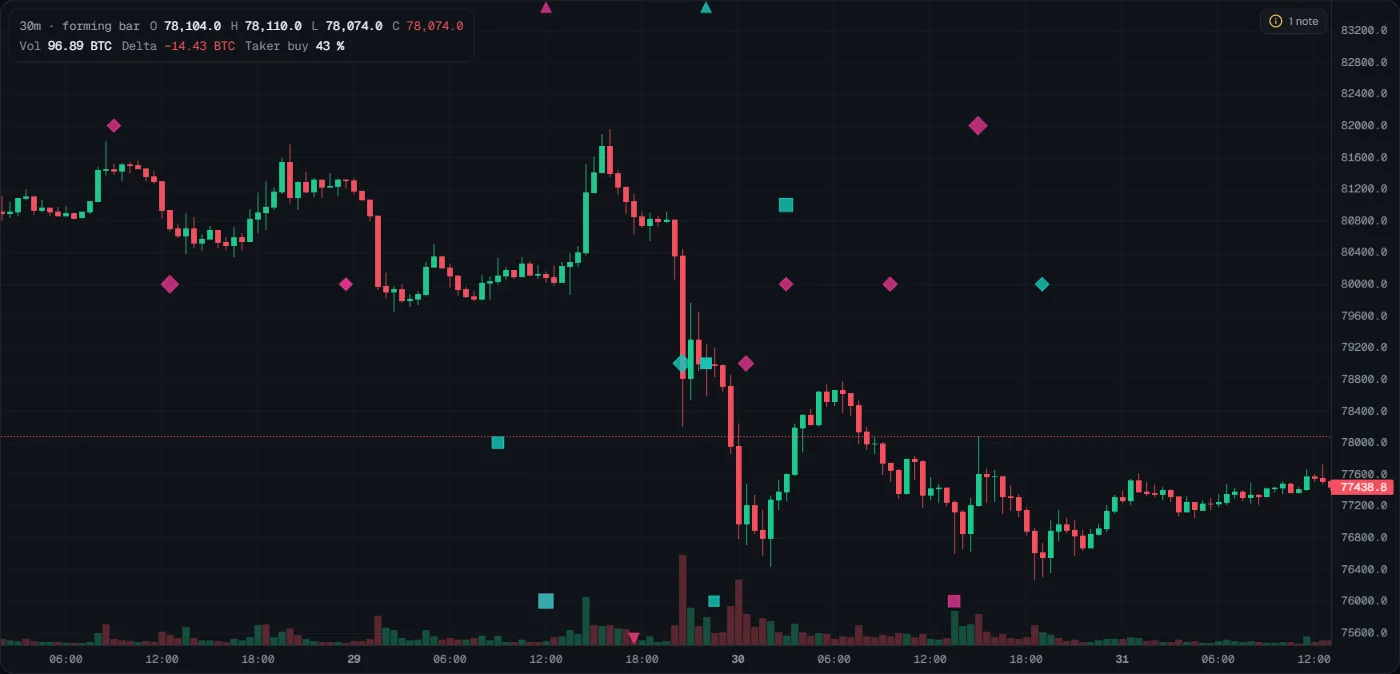
The Deribit option trades with the largest premium, at their strike: diamonds calls, squares puts, teal bought, magenta sold. Opening or closing is unknown.
Markers for the Deribit option trades where the most money changed hands. They answer: where did someone pay up for options, for which strike, and did they buy or sell? Off by default; turn it on in Indicators → Options (estimated, Deribit) → Big option flows.
- What you see
- A diamond is a call, a square is a put. Teal: the customer (the side that hit the trade) bought. Magenta: the customer sold. Bigger marker = more premium paid. Each sits at the time of the trade and at its strike, shown on the perp's price scale. A strike off the chart shows as an arrow at the edge (at most 3 per edge, the largest). In the picture the markers sit on round strikes: calls sold at 80,000 several times and once, large, at 82,000 on the afternoon of 30 October (magenta diamonds); puts bought at 76,000 and 78,000 (teal squares). Hover one for the trade; a hover reads like Call bought · $1.2M premium · 80,000 strike · exp 31 Oct (0DTE) · IV 52 % · block. IV is the option's implied volatility (how big a move its price assumes); a block is a large trade agreed privately and reported to Deribit.
- How to read it
- Premium is the money paid for the option (price × quantity, in USD). It measures how much was at stake.
- A call bought pays off if price rises past the strike. A put bought pays off if price falls below it.
- Several markers at one strike mean money is focused on that price.
- The expiry matters: a 0DTE trade expires within a day; a monthly one is a longer view.
- What it tells you
- Where large option money went, and which way the aggressive side traded. It does not tell you whether a trade opened or closed a position: Deribit does not publish that. A "call bought" can be a new bet on a rise or someone closing a short call.
- How to use it
- Hover the largest markers near price. Note the strike, the expiry and bought or sold. A strike with several big trades that also sits near a gamma line or a level is a price worth watching closely. Then read the flow there as usual; the option trade alone is not a reason to enter.
- Common mistakes
- Reading every bought call as "someone knows price will rise". It can be a hedge, a spread leg or a closing trade.
- Ignoring the expiry: a big 0DTE trade says nothing about next week.
- Thinking the marker is a target. It shows the strike of an option, not where price must go.
Which trades are shown
| Coin | Shown from (premium, default) | About how many a day |
|---|---|---|
| BTC | $250,000 | 15 |
| ETH | $50,000 | 10 |
Counts are from 30 days of Deribit trades, measured on 31 October 2026. In Settings you can change the premium floor, keep only some expiries (0DTE, 1, 7 or 31 days), keep only bought or sold trades, and hide a call and a put of the same strike and expiry traded in the same second (a straddle or offsetting legs; hidden by default). The chart's notes say which floor is in use.