

Options gamma: advanced (off by default)
Gamma through time
Off by default: dynamic walls, the expected move through time and dealer pressure, drawn on the price chart.
These layers draw options readings through time on the price chart. They are off by default; turn each on in Indicators → Options (estimated, Deribit). Dealer positions come from your Gamma model setting. The default, taker-flow, replays every Deribit option trade since listing and assumes the side that did not hit the trade is a dealer. Classic assumes dealers are long every call and short every put. Both are estimates.
Dynamic walls
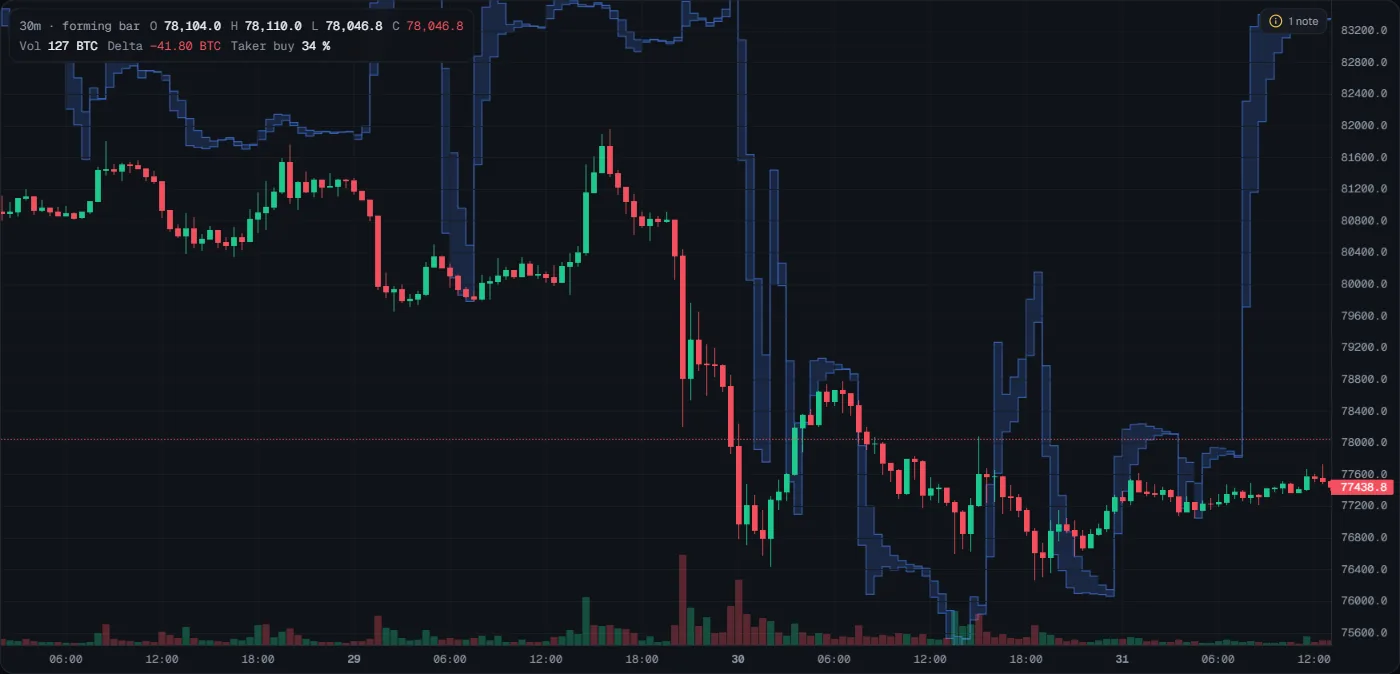
- What you see
- A blue ribbon between a fast (30 minutes) and a slow (2 hours) average of zero gamma. It breaks where a snapshot had no zero gamma. In the picture it jumps a lot: on 30 October it swings between about 76,000 and 80,000 around price, and on the morning of 31 October it jumps from about 77,800 to 83,200, because zero gamma itself jumped to another strike.
- How to read it
- Price above the ribbon reads as trend up, below as trend down, inside as range. This is Tactiq's own rule and Tactiq has not measured it.
- The ribbon can jump thousands of USD when zero gamma moves to another strike; after a jump the read can say "trend down" during a calm drift, as at the right of the picture.
- What it tells you
- Where price sits against the recent flip, smoothed. It does not predict the next move.
- How to use it
- At most as background context next to the Flag and the zones. Do not choose long or short from it: the rule is not measured and the ribbon jumps.
- Common mistakes
- Trading every cross of the ribbon.
- Reading a sudden jump of the ribbon as a market move: zero gamma moved to another strike.
- Reading a break in the ribbon as missing data: no zero gamma existed then.
Expected move
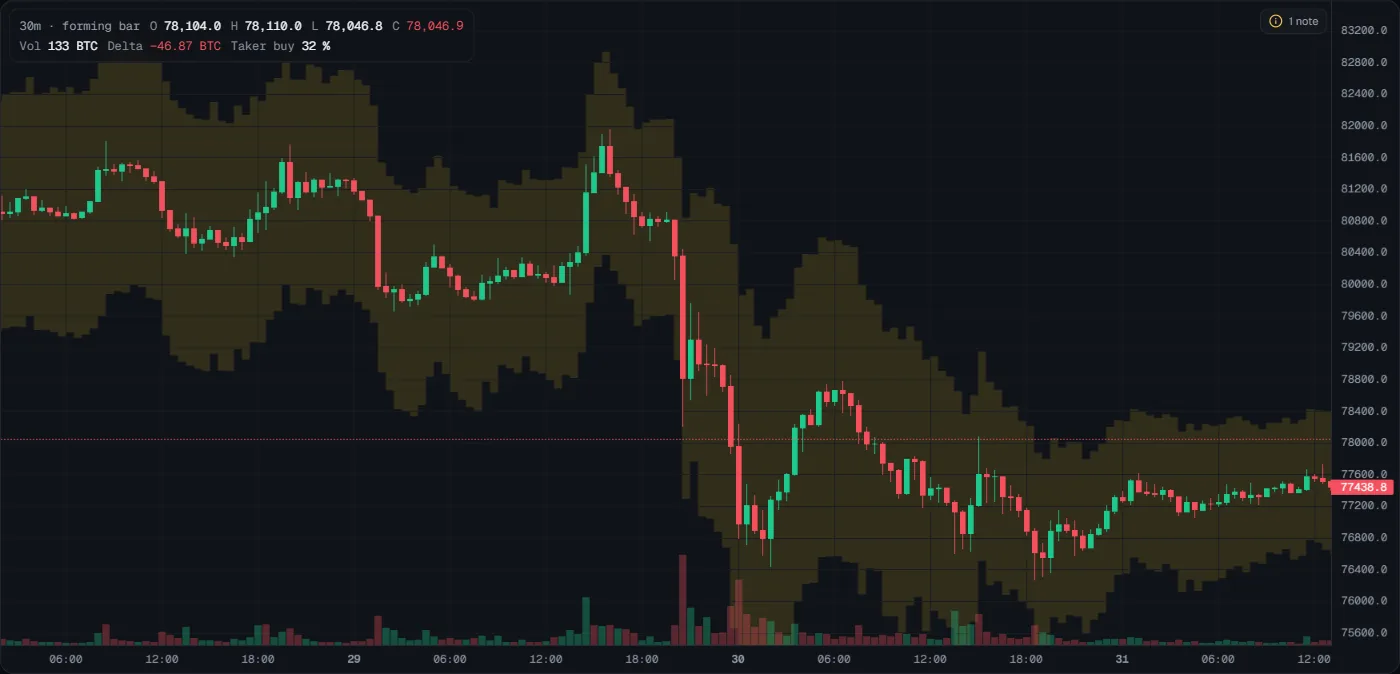
- What you see
- A gold band through time: the ±1σ one-day move options implied at each snapshot. In the picture, the fall on the evening of 29 October broke out of the band, and the band then widened on 30 October (options priced bigger moves after the shock) before narrowing again on 31 October to about 76,600 to 78,400.
- How to read it
- A widening band: options price bigger moves.
- Price riding the band edge: a strong day, but at ±1σ about 1 day in 3 gets there.
- What it tells you
- How expected volatility changed, and how today compares with it.
- How to use it
- When the band narrows, keep targets modest. When it widens, use a wider stop with a smaller size, so the money at risk stays the same.
- Common mistakes
- Fading price at the band edge without a sign from flow.
Dealer pressure
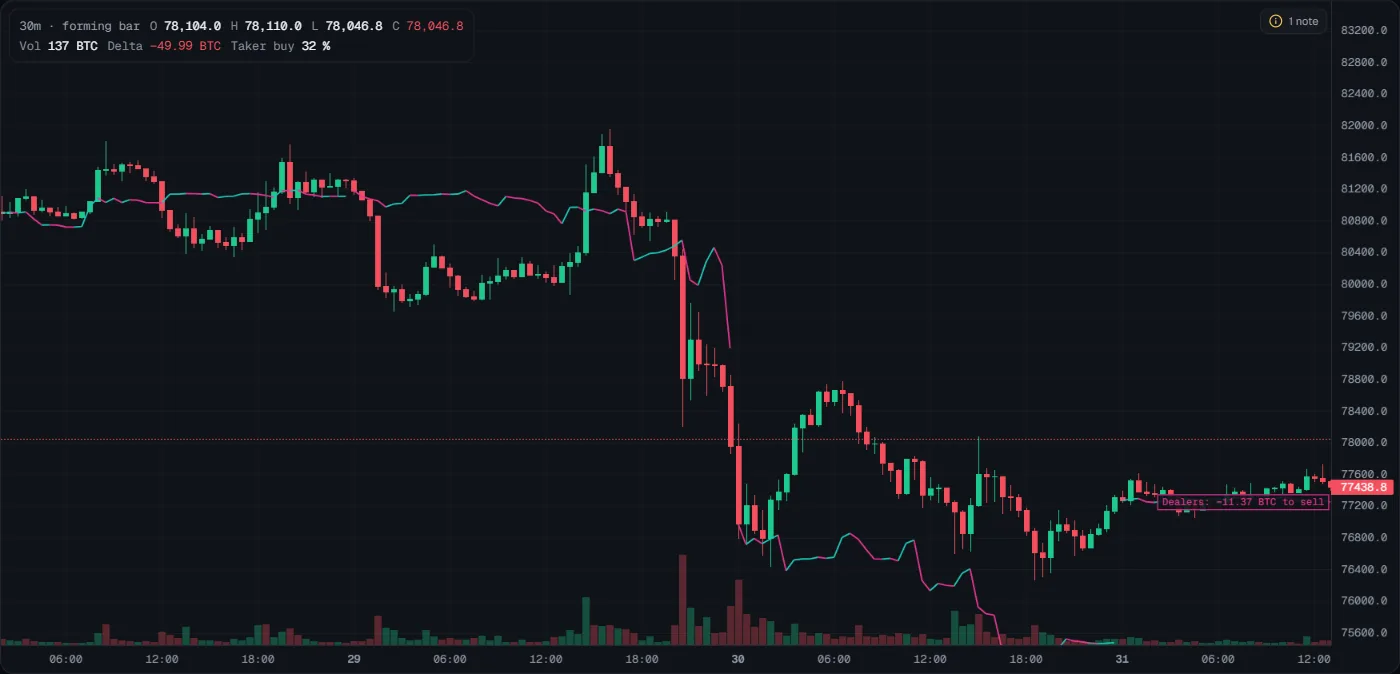
- What you see
- A line scaled into the price range, starting from the first visible close: what option dealers must trade to stay hedged after customers' option trades since 00:00 UTC. The colour shows the direction of the line: teal where it rises (dealers must buy more), magenta where it falls (they must sell more). Intraday timeframes only. The tag at the right gives the day's total in plain words; in the picture, Dealers: −11.37 BTC to sell. On 30 October the line fell to the bottom of the chart as customers' option trades left dealers needing to sell; it restarts each day at 00:00 UTC.
- How to read it
- Price and pressure rising together: option hedging feeds the rally.
- Price up while pressure falls: a rally not fed by option hedging.
- What it tells you
- Whether options trading is adding to or against the move today. It is an estimate.
- How to use it
- When price rises but pressure falls, be careful chasing the rally.
- Common mistakes
- Reading the line's height as a price level: it is scaled into the chart only to compare shapes.
Last updated 2026-10-31. This page as Markdown: /docs/gamma-through-time.md