

Reading the market
Panes below the chart
The panes below the chart: delta, open interest, funding and basis, and what each says about aggression and positioning.
Panes sit under the price chart and share its time axis. Each has its title and latest value on the right axis. Turn each one on in Indicators → Panes below the chart.
Delta
- What you see
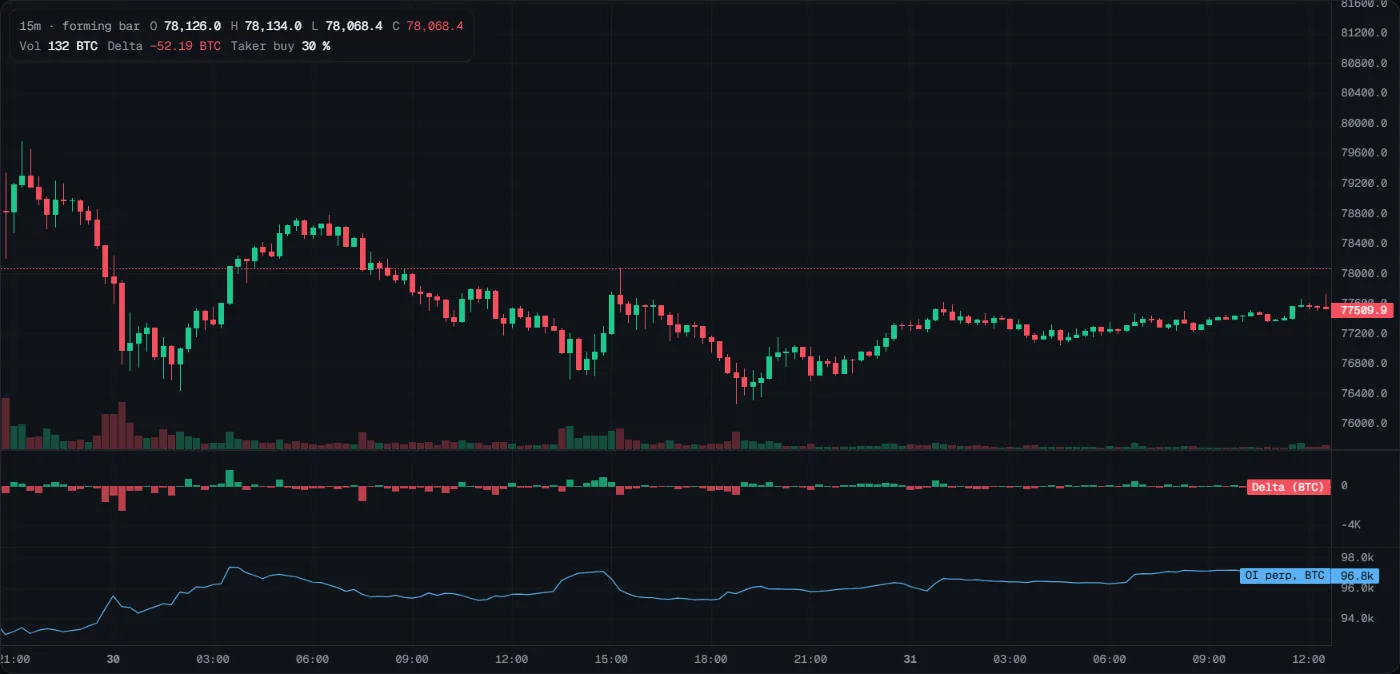
- Bars around a zero line: teal when aggressive buying beat aggressive selling in that bar, red when selling won. In the picture, the deepest red bars (about −2,500 BTC) are the end of the sharp fall, around midnight going into 30 October.
- How to read it
- Positive: buyers were more aggressive. Negative: sellers were.
- Compare with price: strong delta with no price move is absorption. A new high on weaker delta is divergence.
- What it tells you
- Who was aggressive, bar by bar. It does not tell you who will win.
- How to use it
- At a zone or a level, look for delta against the move that does not move price: heavy selling at a teal zone while price holds means sellers are being absorbed.
- Common mistakes
- Treating big delta as a signal to follow. Aggression often stalls.
- Comparing delta across instruments: it is in the base asset (BTC or ETH).
Open interest
- What you see
- A blue line: the number of open perpetual contracts, in the base asset, with the latest value on the right (OI perp, BTC 96.8k in the picture above). In the picture, OI rose from about 94k to 97.5k BTC between 00:00 and 03:00 on 30 October, during the bounce after the fall: positions were being opened.
- How to read it
- Price up, OI up: likely new longs. Price up, OI down: likely shorts closing.
- Price down, OI up: likely new shorts. Price down, OI down: likely longs closing.
- What it tells you
- Whether a move is built on new positions or on closing ones. Traders often say moves with new positions last longer (Tactiq has not measured this). OI does not tell you which side holds them.
- How to use it
- When price breaks a level, check OI. Breakout with rising OI: new positions back it. Breakout with falling OI: mostly closing, which can fade.
- Common mistakes
- Reading rising OI as bullish. Every contract has a long and a short.
- Ignoring the size of the change: a small wiggle says little.
Funding
- What you see
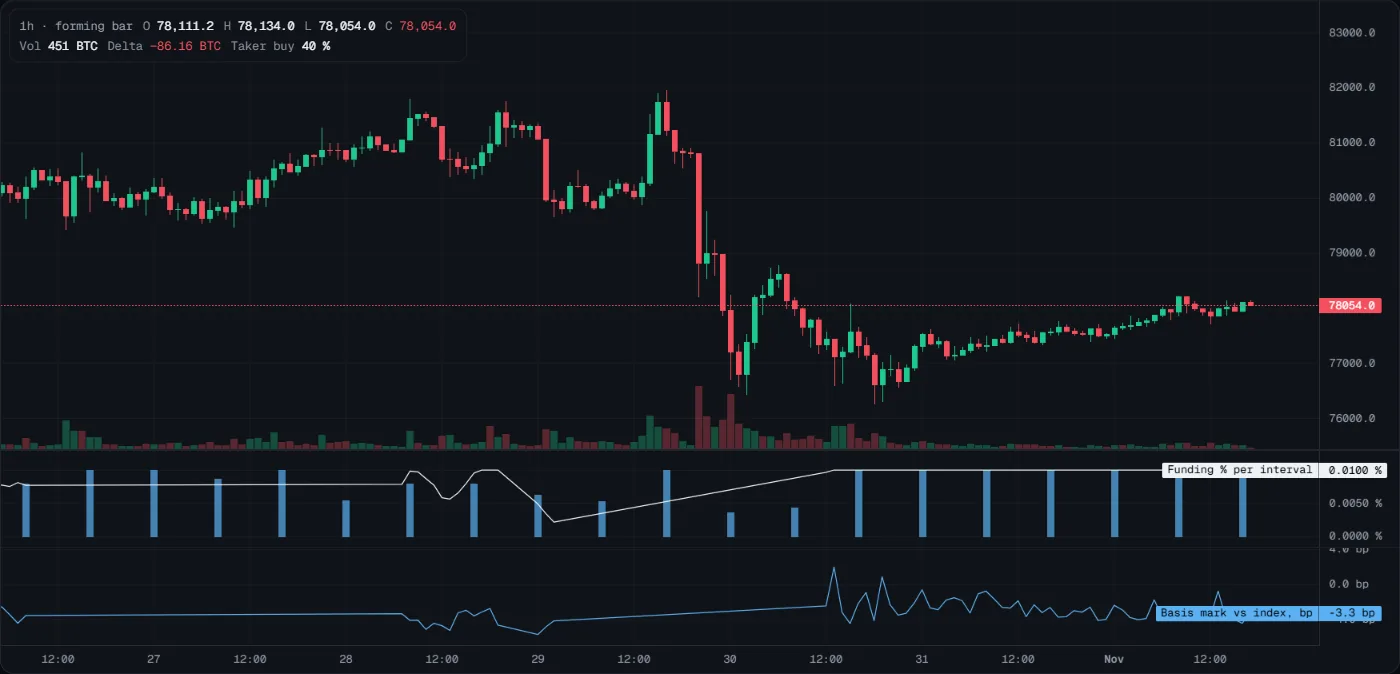
- Bars at each settlement and a white line. A bar is the rate that was paid: blue when longs paid shorts, amber when shorts paid longs. The line is the live estimate for the next settlement. In the picture, every bar is blue and the estimate sits at 0.0100 % per interval: longs paying a normal amount. The estimate dipped to about 0.0025 % on 29 October and climbed back. A long straight stretch of the line means few estimates were recorded there, not a steady rate.
- How to read it
- High positive funding: longs are crowded and pay to stay. Negative: shorts are crowded.
- On timeframes longer than the interval, bars are summed per bar (the title says so).
- What it tells you
- How crowded and how expensive perp positioning is. Crowded positioning can unwind fast against the crowd. It does not tell you when.
- How to use it
- Before a long, check funding: very high funding means you join a crowd that pays to stay in. That is a reason for a smaller size or a better price, not a reason to short.
- Common mistakes
- Shorting just because funding is high: it can stay high for a long time.
- Assuming 8 hours: the interval differs by instrument (gold settles every 4 hours).
Basis
- What you see
- A blue line: the perpetual mark price against the spot index, in basis points (1 bp = 0.01 %). It is the bottom pane in the picture above, now at −3.3 bp; over the week it moved between about −6 and +2 bp, small as usual. Straight stretches are spans with no recorded points.
- How to read it
- A high premium: leveraged buyers pay more than spot. A discount: the opposite.
- Basis is small most of the time. Watch its change, not its size.
- What it tells you
- Whether the perpetual trades rich or cheap to spot. A move where only the perpetual's premium jumps is driven by leverage; Tactiq has not measured whether such moves are less stable.
- How to use it
- In a fast rally, a basis that jumps means leverage is driving it. Be careful chasing it.
- Common mistakes
- Reading a few basis points as a signal.
- Forgetting that basis and funding move together: they are not two independent confirmations.
Last updated 2026-10-31. This page as Markdown: /docs/panes.md