

Options gamma: advanced (off by default)
Gamma levels, profiles and zones
Off by default: the options and hedging profiles, gamma levels and walls, expected-move bands, pin and acceleration zones and the gamma heatmap.
These layers show where dealer gamma sits now, strike by strike. They are off by default; turn each on in Indicators → Options (estimated, Deribit). Dealer positions come from your Gamma model setting. The default, taker-flow, replays every Deribit option trade since listing and assumes the side that did not hit the trade is a dealer. Classic assumes dealers are long every call and short every put. Both are estimates. Options count when they expire within the Gamma horizon setting (31 days by default). Strikes are shown on the perp's price scale.
With any of them on, a small card appears at the top left, for example Long γ · +$1.4M/1% · Live · est · taker-flow · as of 14:04 UTC: the regime at the current price (dealers long gamma, about 1.4 million USD of hedging per 1 % move), the feed state, the model and the time of the estimate.
Options profile
- What you see
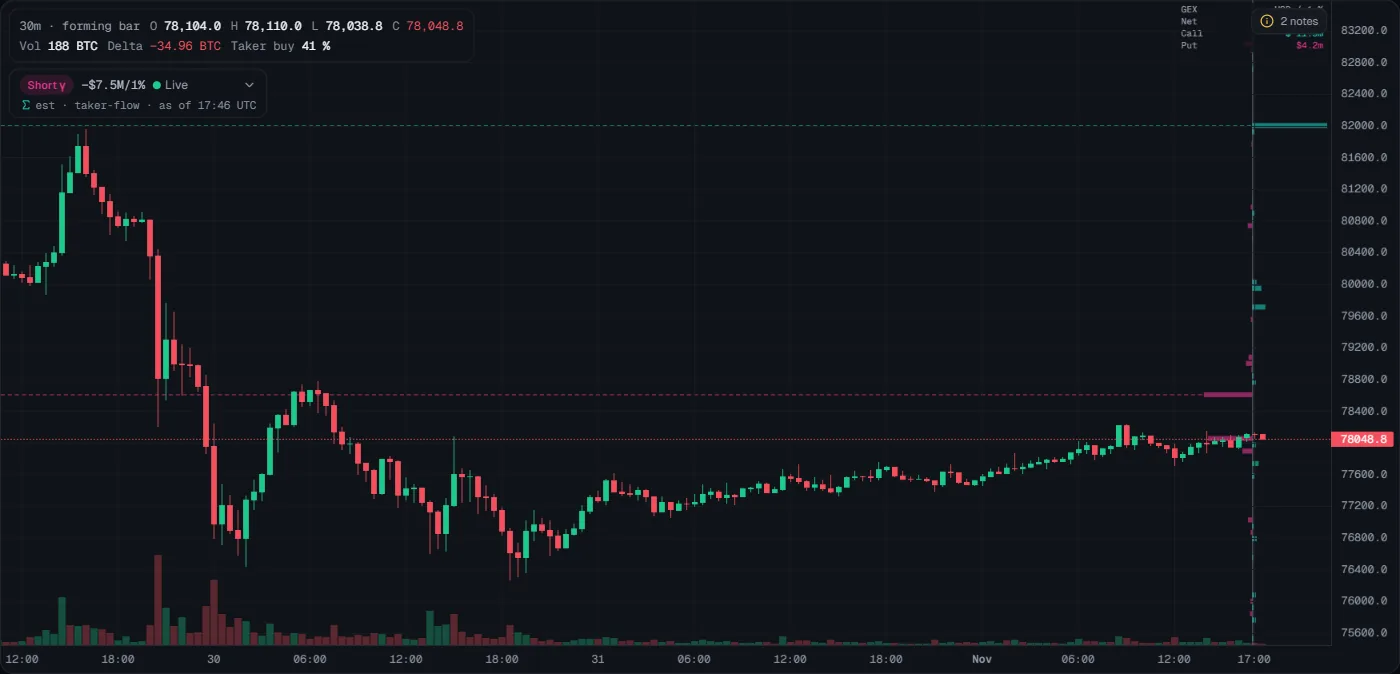
- A bar chart at the right edge, one bar per strike, from an axis. With the default source, teal bars to the right are positive dealer gamma and magenta bars to the left negative. In the picture the longest bar is teal at 82,000, marked across the chart by a dashed teal peak line; just above and at price, near 78,600 and 78,000, the bars are magenta (the one at 78,600 with a dashed magenta peak line). The small box at the top right sums net, call and put gamma. The card can say Long γ while the bars at price are magenta: the card sums every strike's gamma at the current price, so single strikes near price can be negative while the total is positive. Other sources (Settings): calls and puts apart, dealer delta, open interest or 24 h volume (calls right, puts left).
- How to read it
- The longest teal bars are the strikes where hedging may calm price most.
- Long magenta bars are strikes where hedging may speed price.
- Optional outlines show the profile 5, 15 or 30 minutes ago, or on previous days, to see what changed.
- What it tells you
- The shape of dealer gamma across prices right now. It does not show positions you can verify: it is an estimate.
- How to use it
- Look for the biggest bar near price on each side; those are the strikes to watch. Compare with the envelopes: when both point to the same price, that price matters more.
- Common mistakes
- Confusing it with the volume profile. This one is options, per strike, not traded volume per price.
- Reading far-away strikes as near-term levels.
Hedging profile
- What you see
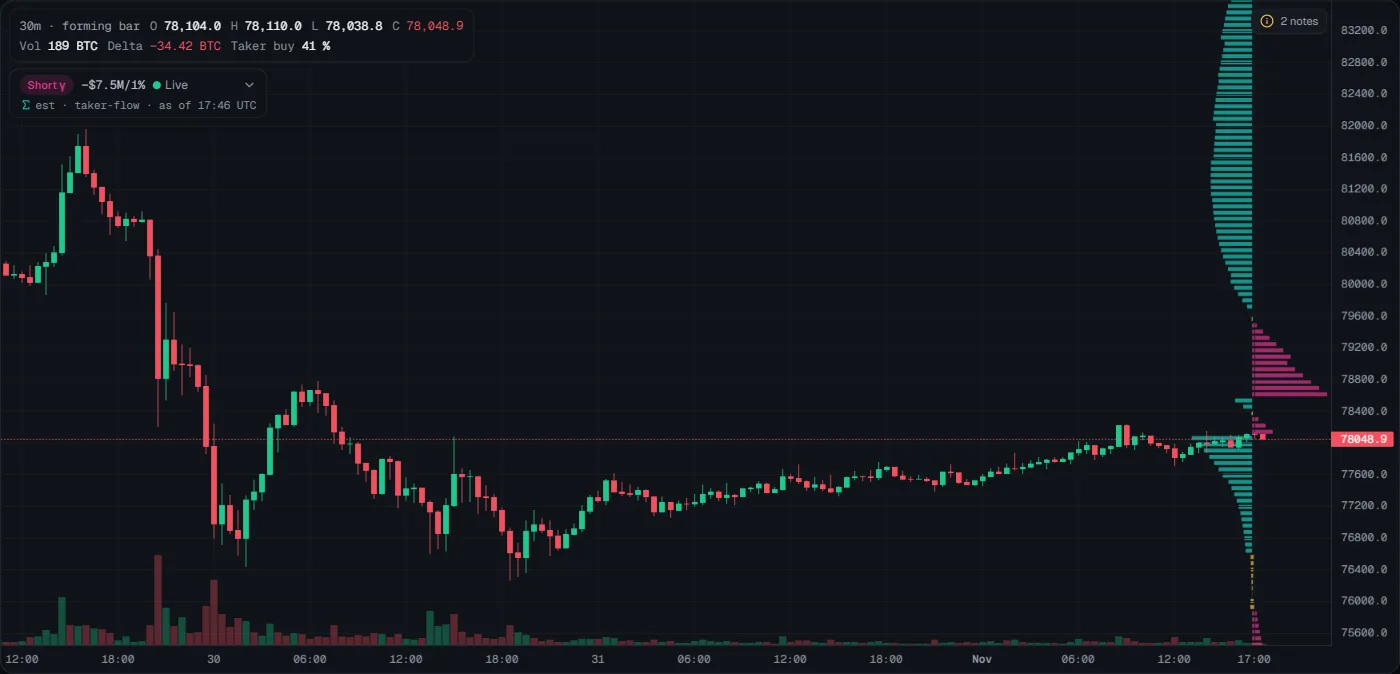
- Bars from an axis at the right edge: how many coins dealers would trade for a +1 % move at each price, with gamma plus vanna (volatility) and one day of charm (time decay). Teal, left: their hedging dampens the move. Magenta, right: it amplifies it. Yellow: neutral. In the picture the bars are teal above about 79,700 (longest near 81,200) and below price, but magenta from about 78,500 to 79,600, just above price: in this estimate, a rally into that band would be amplified by hedging, while further up and below price hedging would lean against the move.
- How to read it
- Teal near price: moves there tend to be absorbed by hedging.
- Magenta near price: hedging adds to the move.
- What it tells you
- A fuller estimate of hedging than gamma alone. It does not say the move will happen.
- How to use it
- Before a breakout trade, look at the bars just beyond the breakout price. Magenta there: a break may run. Teal there: a break may stall.
- Common mistakes
- Reading bar length as an order size on the book. It is a model of dealer hedging.
- Using it on gold: there are no gold options.
Gamma levels
- What you see
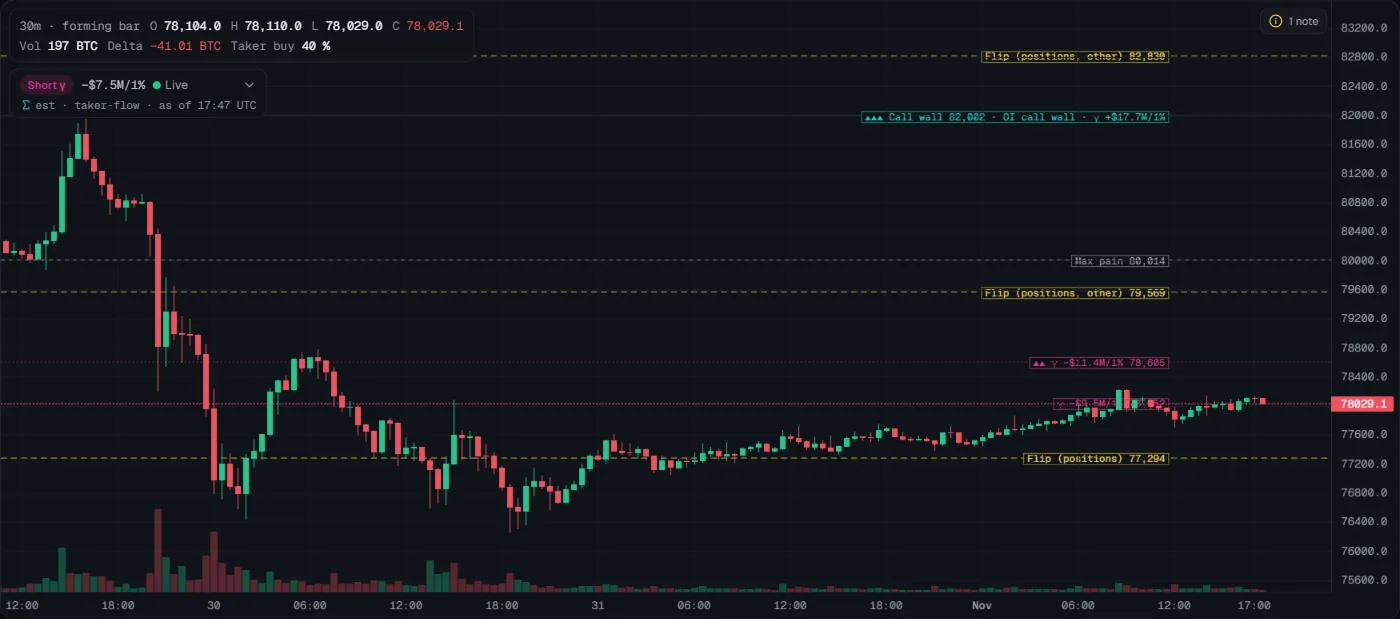
- Horizontal lines with labels: Flip (positions) (yellow, dashed; other crossings Flip (positions, other)), Call wall (teal), Put wall (magenta), optional OI walls, Max pain of the next expiry (grey, dashed) and the largest gamma strikes ranked with triangles (▲▲▲ = the largest). Several labels on one price share one line. In the picture: Flip (positions, other) 82,830 at the top; ▲▲▲ Call wall 82,002 · OI call wall · γ +$17.7M/1% (the call wall, the largest call open interest and the largest gamma strike, all at one price); Max pain 80,014; Flip (positions, other) 79,569; two negative-gamma strikes, ▲▲ γ −$11.4M/1% 78,605 just above price and one at price (its tag partly hidden by the candles); and Flip (positions) 77,294, the flip nearest price, below it. No put wall is in view.
- How to read it
- Flip (positions): where dealer gamma from estimated dealer positions changes sign, nearest price first. The card's Long γ / Short γ is the sign at the current price. In the picture the card says Short γ and the nearest flip, 77,294, is below price: gamma is negative from there up through price, and the calm side is below 77,294.
- Call wall: the strike with the most call gamma above price; rallies may slow there.
- Put wall: the strike with the most put gamma below price; drops may slow there.
- The card sums every strike's gamma at the current price, so Long γ with negative strikes near price is not a contradiction.
- Max pain: the strike where option buyers would collect the least at the next expiry.
- What it tells you
- Today's key options prices by the model. It does not say they will hold.
- How to use it
- Treat the walls like levels: if price reaches the call wall, watch for sellers on the footprint before taking any short idea; a close above the wall means it did not hold.
- Common mistakes
- Assuming price is drawn to max pain. That is a popular idea, not a measured fact.
- Trading the flip line on its own.
- Expecting this flip to equal the yellow Zero γ of the envelopes. The flip comes from estimated dealer positions (everything open), the envelopes from the last 24 h of options volume (what traded recently), so they can be far apart. In these pictures they are close (77,294 and 76,570), but that is not the rule. Neither is wrong; they answer different questions.
Expected-move bands
- What you see
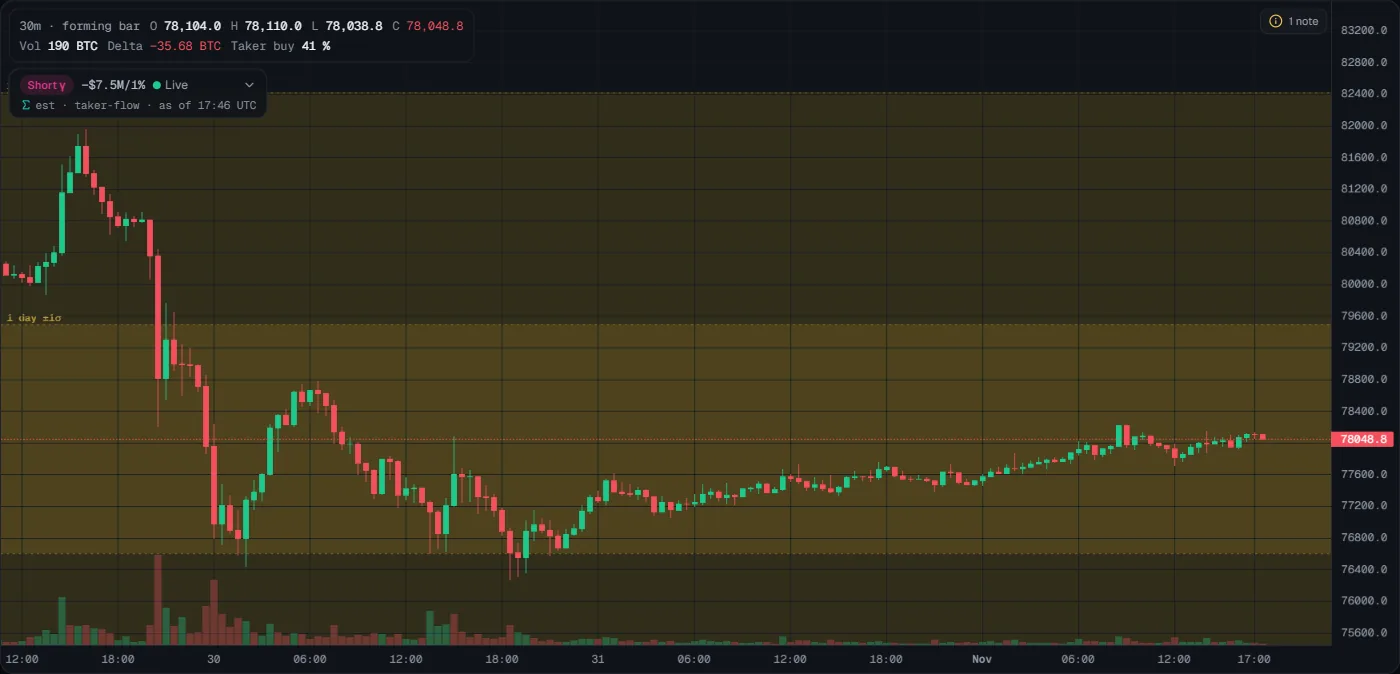
- Translucent gold bands around the current price, drawn across the whole chart and labelled 1 day ±1σ and 1 week ±1σ (±2σ, fainter, in Settings). In the picture the 1-day band runs from about 76,600 to 79,500, so options price a typical day at about ±1,450 USD; the 1-week band reaches 82,400 and past the bottom of the chart. They are today's bands, not history: the older candles were not judged against them.
- How to read it
- The ±1σ band is where options price about two thirds of outcomes to end.
- So a close outside the 1-day ±1σ band happens on about 1 day in 3. Outside ±2σ is unusual.
- What it tells you
- How big a move options traders are paying for. It does not say which way.
- How to use it
- Size targets and stops with it. A target beyond the 1-day band needs a bigger-than-typical day (about 1 in 3 days goes that far, either way); a stop inside a normal day's range is likely to be hit by noise.
- Common mistakes
- Treating the band edge as support or resistance.
- Forgetting it is implied volatility: it widens after big moves.
Pin & acceleration zones
- What you see
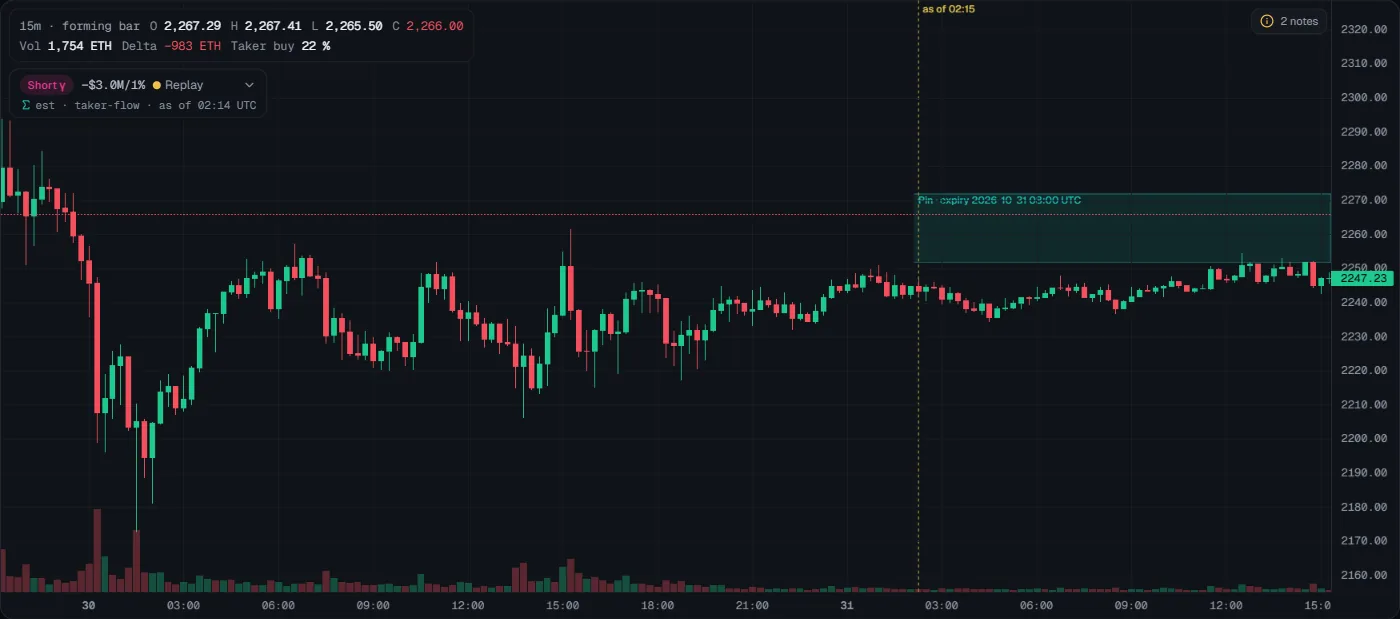
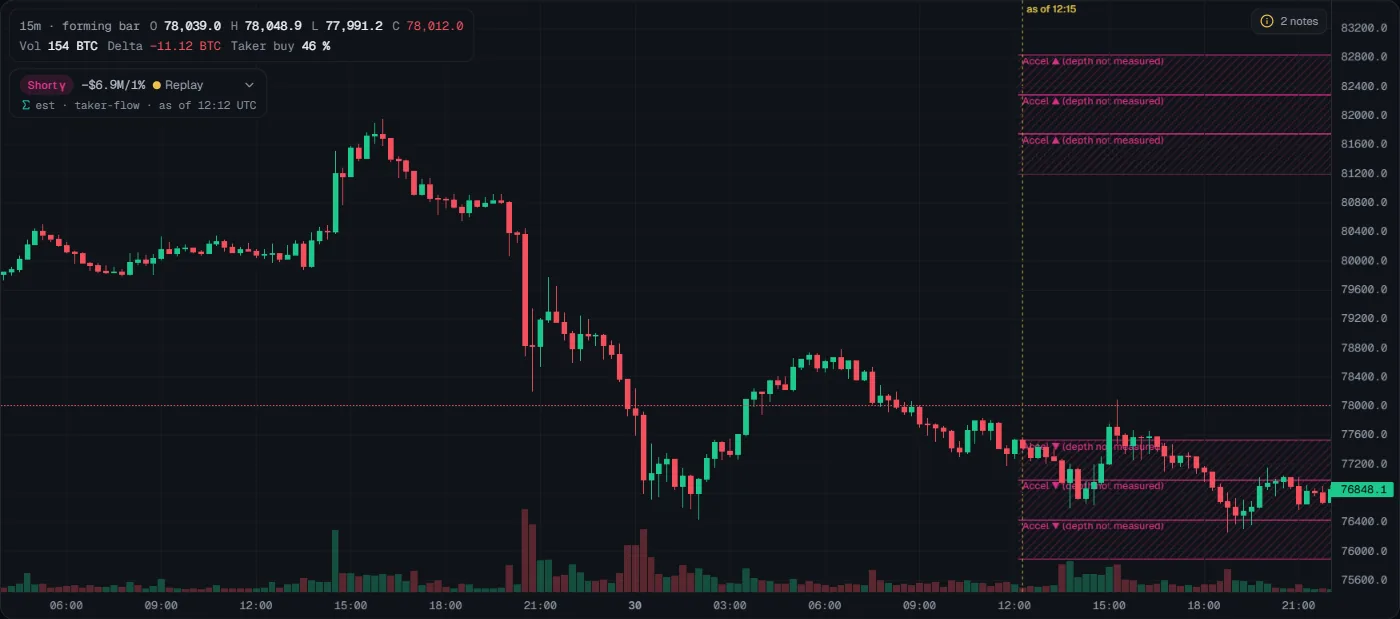
- A shaded band across the chart, named at its left. Teal, Pin · expiry …: a pin zone, around the strike where dealers hold the most positive gamma, shown only in the 48 hours before a large expiry. In the picture it sits at 2,252–2,272, just above price, ahead of the 31 October 08:00 UTC expiry. Magenta, Accel ▲ 2.4×: an acceleration zone, where dealer hedging would be 2.4 times the resting order book (picture below).
- How to read it
- Pin: dealer hedging leans against moves near the strike, so price tends to stay quiet around it until the expiry. After the expiry the zone is gone.
- Acceleration: the ratio is hedging ÷ book depth. At 1× or more, hedging could outweigh the book, so a move into the zone can speed up.
- Hatched magenta: the book depth there was not measured. These are hidden by default (Settings → show zones with depth not measured).
- What it tells you
- Where the options market leans toward calm (pin) or speed (acceleration) right now. It does not say which way price goes, and Tactiq has not measured how often price really pins in crypto.
- How to use it
- Before a pin's expiry, expect chop near it: don't chase a breakout toward the strike, wait for the expiry to pass. Don't put a tight stop inside an acceleration zone, and expect a fast move if price enters one.
- Common mistakes
- Expecting zones every day. They are rare by design; when the layer is on and nothing is drawn, the notes pill says why.
- Treating a pin as a magnet that must pull price to the strike. In the picture, price stayed just under the zone until the expiry.
- Reading a hatched zone as measured.
Gamma heatmap
- What you see
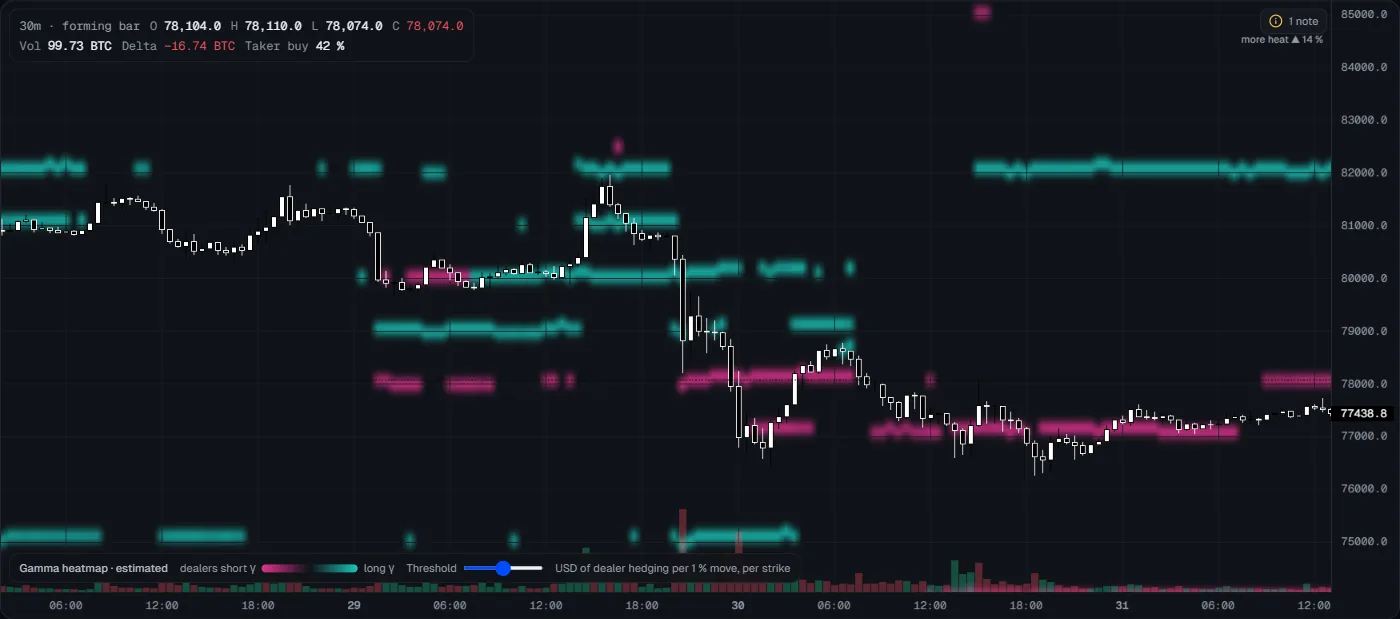
- Glowing bands behind the candles: dealer gamma per strike over time. Teal is long gamma, magenta short; the legend at the bottom says the scale is USD of dealer hedging per 1 % move, per strike, with a Threshold slider. The price axis stays close to the candles, so they are easy to read: it adds room above and below for the strongest heat, at most half a 7-day expected move. Heat beyond that is cut off, and when a side loses a noticeable share of it (10 % or more of the heat on screen), a small more heat ▲ … % or ▼ marker at that edge says how much. In the picture, since midday on 30 October a steady teal band sits at 82,000 (the same strike as the call wall), magenta bands sit right around price near 77,000, a new magenta band appears at 78,000 on 31 October, and the marker says 14 % of the heat lies above the chart. While it is on, it replaces the other heatmaps.
- How to read it
- A steady teal band is a strike that has calmed price for a while.
- Bands that appear or fade show where options positioning changed.
- What it tells you
- How gamma moved through time, not only now. It is an estimate.
- How to use it
- Check whether today's walls are new or have been there for days. Long-standing bands are more notable.
- Common mistakes
- Confusing it with the liquidity heatmap: this is options, not orders in the book.
- Reading brightness as size you can trade against.